Article / Research Article
eclaireMD Foundation, USA
Gerald C. Hsu
eclaireMD Foundation
USA
18 August 2020 ; 8 Septmber 2020
This article is a comparison report of a total of 63,244 glucose data from a type 2 diabetes individual by using three different glucose measurement methods during the recent COVID-19 period over163 days from 2/19/2020 to 7/31/2020. The research methodology utilizes GH-Method: math-physical medicine (MPM) which has been applied for the past decade.
The following table lists three glucose measurement methods and their respective measured glucose data amount over the past 163 days.
Finger : 652 at 4 per day
CGM 15-min : 15,648 at 96 per day
CGM 5-min : 46,944 at 288 per day
Total glucose : 63,244 at 388 per day
The following cover the highlights of the author’s medical conditions:
He is a 73-year-old male with 25 years of T2D history since 1995.
He had suffered from many diabetes complications (except stroke) from 2000 to 2013, including renal complications, five cardiovascular episodes, bladder infection, foot ulcer, diabetic retinopathy, and hypothyroidism. Since 2014, he no longer detects any signs of these diabetic complications.
His BMI was 33 (220 lbs.) in 2010 and 25 (170 lbs.) in 2020. He was taking three diabetes medications and since 12/8/2015, he ceased taking any of them for 5 years. His average glucose in 2010 was 280 mg/dL (FPG ~200 mg/dL and PPG ~300 mg/dL). Currently, his average glucose during this study period, from 2/19/2020 to 7/31/2020, is 109-120 mg/dL (FPG 103-107 mg/dL and PPG 110-125 mg/dL) depending on the glucose measuring method.
In summary, the finger fasting plasma glucose (FPG) represents the upper bound and the finger postprandial plasma glucose (PPG) signifies the lower bound in comparison with the continuous glucose monitor (CGM) method. Finger FPG occupies 25% of the total finger glucose and CGM FPG captures 29.2% (7-hours) of the total CGM glucose. Finger PPG takes up 75% of the total finger glucose while CGM PPG occupies 37.5% (9-hours) of the total CGM glucose. There is a remaining 33.3% (8-hours) of glucoses from between-meals and pre-bedtime which is higher than CGM FPG. Therefore, in a combined figure, the CGM glucoses are “higher” than finger glucoses. The reason CGM 5-min is lower than CGM 15-min is due the additional collected glucoses.
The author has been using the Freestyle Libre CGM system since it became accessible to Americans in early 2018. He started his investigation on his CGM results for at least two years. Although the Finger-piercing method has been available for decades, he still believes that using the CGM device, especially the CGM 5-min method, can provide a more accurate snapshot of his true glucose status. The CGM 15-min method is sufficient for daily monitoring but not for his detailed research utilization. In his opinion, the CGM device should be recommended to the general population of diabetes patients, because it provides a clearer glucose picture due to its ability to provide continuous warnings for hyperglycemic situations.
This article is a comparison report of a total of 63,244 glucose data from a type 2 diabetes individual by using three different glucose measurement methods during the recent COVID-19 period over163 days from 2/19/2020 to 7/31/2020. The research methodology utilizes GH-Method: math-physical medicine (MPM) which has been applied for the past decade.
The author has spent the past 10 years to self-study and research metabolism, endocrinology, and diabetes. He spent his first four years, from 2010 to 2013, to self-study 6 chronic diseases, i.e. obesity, diabetes, hypertension, hyperlipidemia, cardiovascular diseases, stroke, as well as food nutrition. Food is probably the most important and also a complicated input element to influence these 6 chronic diseases. After his first 4-years of reading and learning internal medicine and food nutrition, he then spent the entire year of 2014 to develop a complicated model of metabolism. This mathematical model contains 4 biomarkers of medical conditions (weight, glucose, blood pressure, and lipids) along with 6 lifestyle details (food portion and nutritional balance, water intake, exercise, sleep amount and quality, stress reduction, and daily life routines regularity).
Starting from 2015, he spent three consecutive years (2015-2017) to discover the characteristics and behaviors of this complex “wild beast” of glucose. His major objective is to truly understand the “inner characteristics” of the glucose, not just using medication’s chemical power to control the “external biological symptoms” of the disease. His research work is similar to a horseman trying to tame a horse by understanding its temperament first, not just giving a tranquilizer to calm it down. As a result, during this period of 3 years (2015-2017), he has developed 4 prediction models, which include Weight, PPG, FPG, and HbA1C with extremely high prediction accuracy (99% for glucoses and 95% for HbA1C due to added-in 4% of safety margin) for the purpose of understanding glucoses.
He estimated and proved that PPG contributes approximately 75% to 85% towards HbA1C formation. Therefore, he tried to unravel the mystery of PPG first. Through his diabetes research, he has identified at least 19 influential factors associated with PPG formation. Among those influential factors, diet (carbs/sugar amount) would provide ~38% and exercise (post-meal walking) would contribute ~41%. Combining these two primary influential factors, it gives ~80% of the PPG formation. Among the remaining 17 secondary factors, a high weather temperature contributes ~5%, whereas stress and illness only make noticeable contributions when they occur.
For most T2D patients who take medications, its biochemical effect would become the most significant influential factor. However, as we know, medication cannot cure diabetes (internal issues) and only control its symptoms (external signals). Therefore, the author decided to focus on diabetes control at the most fundamental level by investigating the root cause of this disease. Previously, he took high doses of three prescribed diabetes medications for 18 years since 1997; however, in 2013, he reduced the number of prescriptions and dosages of his daily medications. By 12/8/2015, he finally ceased taking any diabetes medications.
From 2016 to 2017, he discovered a solid connection between his FPG and his weight (>90% of correlation). In addition, similar to his PPG research, he also recognized that there are about 5 influential factors of FPG formation with weight alone contributing >85% and cold weather temperature influencing ~5%. It should be noted that he reduced his weight from 220 pounds (100 kg) in 2010 down to 170 pounds (77 kg) in 2020. He has also maintained his body weight around 172 pounds (78 kg) between 2015 and 2020.
Since July 2019, he launched his investigation on the degree of damage to his pancreatic beta cells. During the past year of research work, he noticed that both of his FPG and PPG have been decreased in the last 6 to 8 years at an annual rate of 2.3% to 3.2%. In other words, his pancreatic beta cells have been self-regenerating or self-repairing about 14% to 26% over these years. He then thought about FPG (actually between 92% to 97% of FPG value) as being a good indicator on how healthy his pancreatic beta cells are since there are no food intake and exercise while sleeping. Nevertheless, his body weight has been maintained around 172.6 lbs. along with being medication-free for the past 5-years. When he removes the primary factors of food, exercise, weight, and medications, it makes sense to him that FPG carries a significant and clear message about the baseline status of his overall glucoses from the pancreatic beta cells.
The detailed explanation of his glucose research work is provided because this particular comparison study is based on “glucoses”.
The following table lists three glucose measurement methods and their respective measured glucose data amount over the past 163 days.
Finger : 652 at 4 per day
CGM 15-min : 15,648 at 96 per day
CGM 5-min : 46,944 at 288 per day
Total glucose : 63,244 at 388 per day
On 1/1/2012, he started to measure his glucoses by the finger-piercing method 4 times a day, including once in the early morning after waking up, and 3 times at two hours after the first bite of his meal.
On 5/5/2018, he applied the Libre Freestyle CGM device on his upper arm and measured his glucose value every 15 minutes. In this way, he could collect 96 data per day. However, he found that he has spent vast amount of his valuable hours on this data collection and recording task.
Therefore, on 2/19/2020, he installed a specially designed electronic device using Bluetooth technology to transmit data from the CGM to an iPhone using his customized computer software. (The author spent about 30 years in high-tech industries, including AI software, computer hardware, and semiconductors.) He designed this new data collection method to transmit his glucose data at a frequency of every 5 minutes. His purpose of collecting more data is to investigate the damage to his own internal organs due to the lower-amplitude but higher-frequency glucose components which are overlooked by most medical research professionals. They usually focus on the results of hyperglycemia (e.g. time-above-range, TAR) and hypoglycemia (e.g. time-below-range, TBR); therefore, they do not pay much attention to the effect from the vast amount (~80%) of “in-between” glucose components (e.g. time-in-range, TIR). His initial finding is that there is a sort of “80/20 rule” existing among glucoses. In other words, there are ~80% lower-amplitude glucoses which cause ~20% energies carried by them to influences or even damage the health state of internal organs.
He continues to record and program the glucose data at every 15 minutes by using a partial dataset from his 5-min device dataset. As a result, he can automatically collect both CGM-5 min at 288 times a day along with CGM 15-min at 96 times a day. This automation approach saves a significant amount of time, so he can devote his efforts on the actual research work.
While no device is free of defects, the existing glucose measuring device has inherent reliability problems. The author has published several papers regarding these reliability issues related to CGM devices. Even the traditional finger piercing device has flaws with its precision and reliability regarding its measured data. On occasion, the measurement results deviation could be as high as 25% or more. In addition, the current advice from the healthcare community regarding the timing of the finger measured glucoses for both FPG and PPG have questionable concerns. For example, the peak PPG usually occurs between 45 minutes to 75 minutes, or around 60 minutes, after the first bite of meal, not the standard advice of two hours after.
This study report contains data comparison and interpretations of the author’s own collected data over a period of 163 days, during the COVID-19 period from 2/19/2020 to 7/31/2020.
The following cover the highlights of the author’s medical conditions:
He is a 73-year-old male with 25 years of T2D history since 1995.
He had suffered from many diabetes complications (except stroke) from 2000 to 2013, including renal complications, five cardiovascular episodes, bladder infection, foot ulcer, diabetic retinopathy, and hypothyroidism. Since 2014, he no longer detects any signs of these diabetic complications.
His BMI was 33 (220 lbs.) in 2010 and 25 (170 lbs.) in 2020. He was taking three diabetes medications and since 12/8/2015, he ceased taking any of them for 5 years. His average glucose in 2010 was 280 mg/dL (FPG ~200 mg/dL and PPG ~300 mg/dL). Currently, his average glucose during this study period from 2/19/2020 to 7/31/2020 is 109-120 mg/dL (FPG 103-107 mg/dL and PPG 110-125 mg/dL) depends on different glucose measuring methods.
His detailed glucose conditions will be further explained in the following sections.
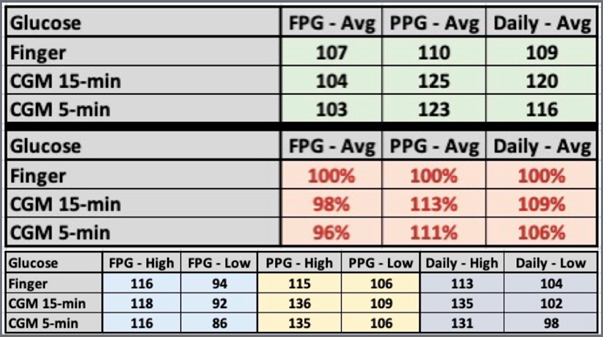 Figure 1: Data table of FPG, PPG, Daily glucose from Finger, CGM 15-minutes, and CGM 5-minutes (2/19/2020 – 7/31/2020)
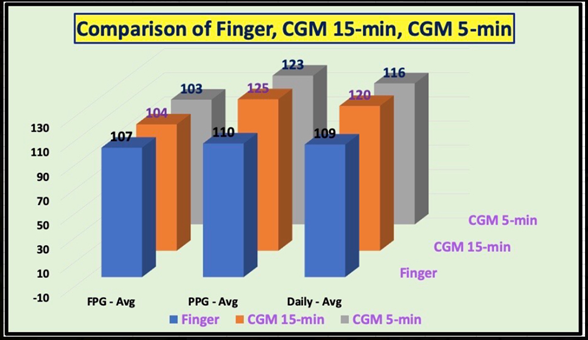
Figure 2: Bar chart of FPG, PPG, Daily glucose from Finger, CGM 15-minutes, and CGM 5-minutes (2/19/2020 – 7/31/2020)
Figures 1 and 2 show the data table and bar chart of three kinds of glucose comparisons.
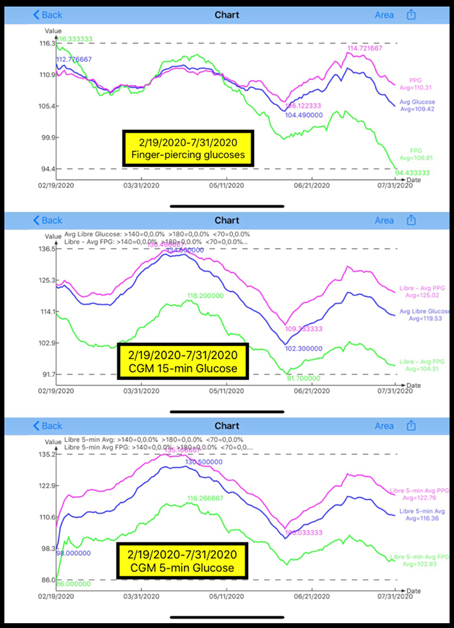 Figure 3: Glucose Comparison from 3 collection methods (2/19/2020 – 7/31/2020)
Figure 3 depicts the comparison of 3 glucose results from Finger, CGM 15-minutes and CGM 5-minutes methods.
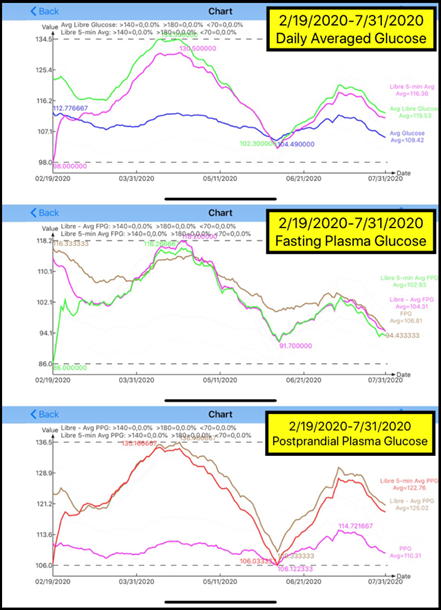 Figure 4: Glucose Comparison of daily glucoses, FPG, and PPG (2/19/2020 – 7/31/2020)
Figure 4 reflects the comparison of FPG, PPG, and Daily glucose by 3 different glucose measuring methods.
For the daily average glucoses, the result for finger-piercing is 109 mg/dL, whereas the CGM 15-min is 120 mg/dL (9% higher than finger), and the CGM 5-min is 116 mg/dL (6% higher than finger). Finger daily average glucose is the lower bound of these three methods.
The main reason for the “lower” finger PPG values being measured at two-hours after the first bite of a meal is because PPG reaches to its peak approximately 60 minutes and then decreases to its lowest point around 120 minutes. Some medical professionals working with T2D patients mistakenly think that the highest PPG occurs around two-hours; therefore, they would give incorrect advice to their patients in measuring their PPG at 120-minutes. That is why the CGM 15-min PPG is the upper bound of these three methods, 13% higher than the finger PPG, while the CGM 5-min PPG is 11% higher than finger PPG.
In the early mornings, the author measures his finger FPG once he wakes up, usually around 6 am to 7 am. However, in regard to utilizing CGM, he defines his FPG of CGM (both 15-min and 5-min) as the average glucose value between 00:00 and 07:00. During these 7-hours of sleep, he would collect 28 FPG data for 15-min intervals and 84 FPG data for 5-min intervals. His lowest FPG occurs approximately at 04:00, in the middle of his sleep; thus, his finger FPG is 2% higher than CGM 15-min and 4% higher than CGM 5-min. For the FPG case, the Finger FPG is the upper bound of these three methods.
In summary, the finger fasting plasma glucose (FPG) represents the upper bound and the finger postprandial plasma glucose (PPG) signifies the lower bound in comparison with the continuous glucose monitor (CGM) method. Finger FPG occupies 25% of the total finger glucose and CGM FPG captures 29.2% (7-hours) of the total CGM glucose. Finger PPG takes up 75% of the total finger glucose while CGM PPG occupies 37.5% (9-hours) of the total CGM glucose. There is a remaining 33.3% (8-hours) of glucoses from between-meals and pre-bedtime which is higher than CGM FPG. Therefore, in a combined figure, the CGM glucoses are “higher” than finger glucoses. The reason CGM 5-min is lower than CGM 15-min is due the additional collected glucoses
The author has been using the Freestyle Libre CGM system since it became accessible to Americans in early 2018. He started his investigation on his CGM results for at least two years. Although the Finger-piercing method has been available for decades, he still believes that using the CGM device, especially the CGM 5-min method, can provide a more accurate snapshot of his true glucose status. The CGM 15-min method is sufficient for daily monitoring but not for his detailed research utilization. In his opinion, the CGM device should be recommended to the general population of diabetes patients, because it provides a clearer glucose picture due to its ability to provide continuous warnings for hyperglycemic situations [1-7].
- Hsu, Gerald C (2020) A simplified yet accurate linear equation of PPG prediction model for T2D patients using GH-Method: math-physical medicine. Diabetes and Weight Management journal, (1):09-11.
- Hsu, Gerald C (2020) Application of linear equation-based PPG prediction model for four T2D clinic cases using GH-Method: math-physical medicine.
- Hsu, Gerald C (2020) Using GH-Method: Math-Physical Medicine to Conduct the Accuracy Comparison of Two different PPG Prediction Methods. Advances in Theoretical & Computational Physics, 3(2):36-37.
- Hsu, Gerald C (2020) Accuracy of Predicted PPG by using AI Glucometer and GH-Method: math-physical medicine. Archives of Cardiology and Cardiovascular Diseases, 3( 1):17-21.
- Hsu, Gerald C (2020) Comparison of two clinic cases of quantitative lifestyle medicine using GH-Method: math-physical medicine. Archives of Infectious Diseases & Therapy, 4(2):62-66.
- Hsu, Gerald C (2020) A case study of the impact on glucose, particularly postprandial plasma glucose based on the 14-day sensor device reliability using GH-Method: math-physical medicine. Journal of Bioscience & Biomedical Engineering, 1(1).
- Hsu, Gerald C (2020) Predicting Finger PPG by using Sensor PPG waveform and data via regression analysis with three different methods via GH-Method: math-physical medicine. EC Diabetes and Metabolic Research, 4(7):21-24.