
Article / Research Article
AKA Mervat Kelada,MD., 1001 Blair Ave, Calexico, CA 92231.
Mervat Kelada, M.D.
AKA Mervat Kelada,MD.,
1001 Blair Ave,
Calexico, CA 92231.
1 November 2023; 27 November 2023
I definitely enjoyed learning more about my patients, it was an educational experience. I got involved with such research because my deceased son was interested in the idea of creating a project for helping teenagers in particular. Our lives are more comfortable financially, despite my kids being raised by a single divorced parent. As we traveled the world, we saw how other populations are struggling. Lately we have been hearing more on the news, many young adults participating in mass shootings in schools and colleges. Interestingly enough you don’t hear much about similar situations in Europe or other parts of the world. Some of the research questions used were about housing and food availability. In comparison the USA, we have less struggles in day to day living conditions than other countries. What is making them more functional with less crime rates? It was interesting to go through the research, and see what really is causing this phenomenon.
The majority of our population is of Hispanic heritage since we’re on the border of the USA and Mexico. Our community is made up of several small cities, but the county seat is located in El Centro, CA. In this community you find the same old style of the Mexican matrix in which the extended family lives with the grandchildren, but it’s dissolved. Mainly because we’re closer to Mexican roots, and still more intact than Los Angeles or San Diego. I have interviewed more than 50 candidates, and know the majority of them, because they have been my patients for more than 30 years. I was able to collect the information myself, for I am fluent in Spanish as well as English. Despite me being aware of current personal details of the patients’ lives, I have noted several of them denied many facts. For example, a grandma responsible for taking care of 6 grandchildren, because the parents lost their legal rights in the USA, therefore currently being held in jail in Mexicali, Mexico (next city to us across international border), asked her 17 years old granddaughter not to disclose information other than stating they are ok.
Aside from the fact that she plays multiple family roles like, the mother and grandmother, community support via family proximity is great, for example the grandmother’s sister who helps the family a lot. The lack of the family support and proximity, in most cases is not fulminated, and it becomes a major issues despite of the poverty and available financial support within the family. Hispanic communities in Northern California are struggling with issues like blending with the culture, and the melting pot of several cultures, because they are far from their roots. In comparison to families outside Imperial County, siblings of the existing families from Imperial County that left for Los Angeles, left behind their roots in the area close to the border. However, what pushed these young adults to join the mafia or become criminals despite the fact they had better food, housing and life opportunities outside Imperial County, and why instead of creating happiness they ended up with miserable outcomes? It took them time to bounce back, come back home to their roots and find a sense of happiness once again. The siblings being involved with many elderly people in the society, interestingly, kept a Mexican family here and another Mexican family in Los Angeles. At their elderlies’ death bed, they come to their loved ones by the border cities. Both families then have to meet each other for the first time, both having different cultures.
What makes European countries be more efficient in day to day lives compared to our country, the USA? I thought that here we live to work and not work to live. In Europe families usually have more time than here because the setup is different therefore facilitating the process. Families usually work till 3 pm, making it possible for the kids and the family to be home together more. I have noticed that the gap of 2-6 pm in which the kids are alone, is a time that can be quite significant for them to do things unsupervised. I have questions, for the majority of my candidates state that the presence of a family member makes a great difference in the upbringing of children. Majority of the time the grandparents’ involvement makes a significant difference in the situation. Although I have collected the information, I feel the questions offered aimed to offer insight at the socioeconomic status and how it might make a significant difference. However, I’m not sure that is the case here. The absolute absence of the mother sometimes from being busy working hard, can be the answer. For example, the grandmother playing multiple family roles, who managed to get control of her grandchildren after being financially stable with the help of her boyfriend, and family. Another example is a family that consists of farm workers. The parents and their kids share one house because housing here is very expensive. The parents have 4 kids, two who are married, and all live together totaling 13 people in a 3-bedroom home, but they are living in absolute harmony. I know the family very well. The family denies issues other than the lack of privacy. Despite that, they described living together as ideal because they have love for each other. In my opinion that is a successful relationship. I enjoyed looking into my patients closely and indulging into their lives in detail. The state has mandated ACE (adverse childhood experiences) questionnaires for Medicaid patients to be given at times of registration. I hope that I have been a channel to collect information regarding the information above, but I decided to continue with my deceased son’s dream in creating the project with hopes to make a difference in the community with my future projects.
The study involves adverse childhood experience affecting their effectiveness subsequently as adults. Adverse experience includes gangs, the mafia, drug addiction, violence, and social isolation on adults with low socioeconomic status. Materials and methods were used to survey questions for different age population 0-17 years, and 18-30 year’s participants. The survey involved Medicaid low-income participants in which the mediator in the current study was assessed separately, using strengths of the pathways across the independent model’s adverse childhood experience. The respondent was asked for their experience related to ACEs. The self-reported Physical Health Point Likert scale was used for participants to rate their health and physical condition, potential mediator intimate partner’s violence, substance abuse, social distancing, work, instability covariates, and statistics analysis. The analysis followed by Valerie and Vanderwheele in a counterfactual approach, resulted with less than half of the adults involved in the study had experience at least 4 ACEs markers. The discussion goal of this study was to discover ACEs markers that lead to poor health conditions in adulthood. An important contribution to this study is the findings in addition to the ACEs markers score in the IPV questionnaire because it may be more prevalent in low socioeconomic populations. The study in detail researched ACEs markers and their effect on social distances, drug abuse, violence, and work instability.
How does a neighborhood affect children maltreatment among immigrant families? In reviewing the literature, the majority had confirmed children maltreatment, and sexual abuse in Latino immigrants. It was known as the neighborhood structure statistic. However, Beleskey found that it was less in the mixed family population. Data and study samples 20 large state cities that were involved in the children’s wellbeing measure. The study used two components of the neighborhood social process when examining the mother ‘s community using the FFCWS. It included groups affiliated with church and unions to analyze the neighborhood that results in the social processes of three types of child maltreatment; physical assault, psychological aggression, and neglect. Results confirmatory factor analysis CFA showed the five countries observed indicators to support several hypotheses pending the samples, results of the study.
This retrospective cross-sectional study participated by 100 women recruited from inner city gynecological treatment centers, supported both direct and mediation effects of social resources on adult depression and PTSD (post-traumatic stress disorder), Pathway linking CMM to PTSD and depression. Many researches have concluded that impaired social support increases risk of PTSD. Although extensive research shows that traumatic events lead to PTSD less research has been concluded in the role of stress leading to PTSD. The purposes of the current study were to provide better understanding of the mechanisms through wavy cam methods. 100 participants, all women, recruited from the gynecological treatment centers for low income were measured in age, ethnicity, highest education, employment income status, and patient’s marital status. The project offered a stipend of $10 to participants, for the completion of the survey. The results reported were: 85% Child abuse, 66% Emotional abuse, and 35% Sexual abuse. Primary analysis confirmed the factor structure of the latent variably. This discussion about social support mediated the impact of CMM in PTSD, with stress acknowledged as a full mediator.
This study aimed to determine the following:
- The prevalence of ACEs (total and specific) in the clinic’s patient population.
- The prevalence of SDOH (social determinants of health) in the clinic’s patient population.
- The prevalence of ACEs in participants diagnosed with anxiety, depression, PTSD, eating disorders, and bipolar disorder.
- The prevalence of SDOH in participants diagnosed with anxiety, depression, PTSD, eating disorders, and bipolar disorder.
- If increased anxiety (General Anxiety Disorder: GAD-7) and depression (Patient Health Questionnaire: PHQ-9) scores are indicative of participants with increased ACE scores.
The author wanted to enroll 200 participants 18 years of age and older in the study. Participants entering the clinic for standard clinical care were asked if they would like to participate in a research study. Those that agreed went through informed consent before proceeding.
- 18 years or older
- Able to understand and give informed consent on their own.
- Literate in English or Spanish language
- Willing to participate in the research study
- Willing to allow the PI to collect health information including ACE, GAD-7, PHQ-9 and SDOH results and diagnoses of anxiety, depression, PTSD, eating disorders, and/or bipolar disorder.
- Younger than 18 years old
- Unable to understand and give informed consent on their own.
- Illiterate in English or Spanish Language
- Unwilling to participate in the research study
- Unwilling to allow the PI to collect health information including ACEs, GAD-7, PHQ-9 and SDOH results and diagnoses of anxiety, depression, PTSD, eating disorders, and/or bipolar disorder.
The study is scheduled to last until April 7, 2023. This study is a prospective study which involves a study group in Calexico, CA. There will be approximately 200 adult participants selected based on their willingness to participate in a research study. The study will be conducted at De Anza clinic as it enrolls adult patients to determine the prevalence of ACEs and SDOH, and if any relationship exists between these and the diagnoses of anxiety, depression, PTSD, eating disorders, or bipolar disorder. Enrollment to the study will be done by word of mouth. The PI will provide an explanation of study procedures and will address any concerns and/or questions by the participant to ensure that the participant will feel comfortable providing all requested information. Then the participant will complete the informed consent form.
The participant will then complete the ACEs, GAD-7, PHQ-9 and SDOH questionnaires. California’s ACEs Aware Program developed this questionnaire and released it to all physicians within California, encouraging them to utilize this within their practice.(3) Once completed, the PI will collect the data from these questionnaires and diagnoses from the medical charts, anonymize and code the participant’s data, then input it into REDCap™. This data will be analyzed to determine the prevalence of ACEs and SDOH within the participant’s population, as well as determine if any relationship exists between the medical diagnoses (anxiety, depression, PTSD, eating disorders, or bipolar disorder) and a participant’s ACE score and number of SDOH experienced.
The following report summarizes the results of a study on 57 adult patients during normal clinical visits at the De Anza Clinic in Calexico, California. This study aimed to determine the prevalence of adverse childhood experiences (ACEs) and how a person’s ACEs affects their diagnosis of anxiety, post-traumatic stress disorder (PTSD), depression, eating disorders, and bipolar disorder. Enrollment in the study was done by word of mouth. The participants enrolled were seen by the principal investigator (PI) who provided an explanation of the study and its purpose. Participants who agreed to continue, completed the informed consent form, followed by questionnaires like: the ACEs, General Anxiety Disorder (GAD-7), Patient Health (PHQ-9), and the Social Determinants of Health (SDOH) questionnaire. The data from these four questionnaires were collected and analyzed by the PI to determine prevalence of co-occurrences, and if any relationship exists between ACEs, SDOH, and the medical diagnoses examined. This report is for the proposed research mentioned above, and it was very helpful understanding the informed consent process and procedures for the research.
A total of 62 individuals participated in the study. Of the 62 individuals, five (8.1%) were under the age of 18 and were therefore excluded from the analysis resulting in a total sample of 57 participants. Of the 57 participants, 43.9% (n=25) were aged 40-49 (Figure 1). 33.3% (n=19) of participants were aged 20-29. The median age of participants was 37 years old.

Figure 1: Percentage of participants by age

Figure 2: Percentage of participants by gender

Figure 3: Percentage of participants by race
Over half of the participants were female (54.4%, n=31), and 45.6% (n=26) were male (Figure 2). The majority of participants were White (89.5%, n=51) (Figure 3). 5.3% of participants were American Indian or Alaska Native (n=3), 1.8% were Asian (n=1), 1.8% were Black or African American (n=1) and 1.8% were Native Hawaiian or Other Pacific Islander (n=1).
The majority of participants had a high school diploma or a GED (75.4%, n=43). Only one participant (1.8%) reported having a college or graduate degree.
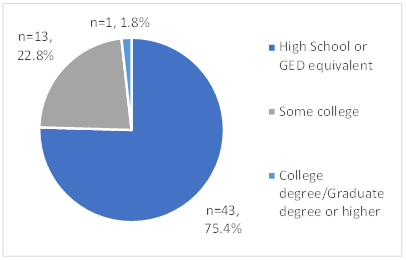 Figure 4: Percentage of participants by education level
What is the prevalence of ACEs (total and specific) in the clinic’s patient population?
Of the 57 participants, the most common ACE score was zero (36.8%, n=21). Slightly less than a third (31.6%, n=18) had an ACE score of four or more (Table 1).
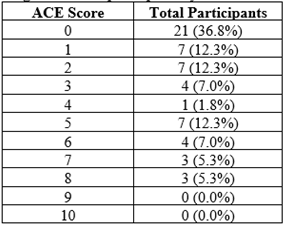 Table 1: Percentage of participants by ACE score
Table 2 shows the total “yes” and “no” responses to each ACE question. (see Appendix I for full ACEs questions) The following questions were three most commonly reported ACEs:
Question 5: Did you often feel that you didn’t have enough to eat, had to wear dirty clothes, or had no one to protect you or that your parents were too drunk or high to take care of you or take you to the doctor if you needed it? – 36.8% (n=21)
Question 9: Was a household member depressed or mentally ill, or did a household member attempt suicide? – 36.8% (n=21)
Question 4: Did you often feel that no one in your family loved you or thought you were important or special or that your family didn’t look out for each other, feel close to each other, or support each other? – 35.1% (n=20)
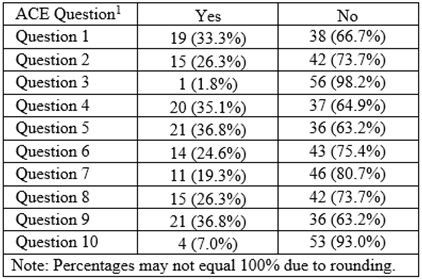 Table 2: Total “yes” and “no” responses to each ACE question
Participants were asked to rank the following areas on a scale of one (extremely insecure) to ten (absolutely secure):
- Food insecurity
- Reliable transportation
- Health insurance
- Ability to pay utility bills
- Reliable internet access
- Access to healthcare
- Stable housing
- Immigration status
- Neighborhood environment
Of a maximum score of 90, scores ranged from 30 to 80. Over half of the participants (56.1%, n=32) had an SDOH score of 60-69 (Figure 5). Only 11 participants (19.3%) had an SDOH score less than 50.
Of a maximum score of 90, scores ranged from 30 to 80. Over half of the participants (56.1%, n=32) had an SDOH score of 60-69 (Figure 5). Only 11 participants (19.3%) had an SDOH score less than 50.
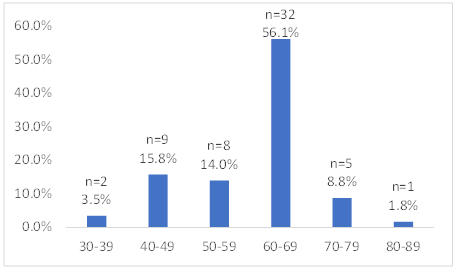 Figure 5: Percentage of participants by SDOH score
Food insecurity (35.1%, n=20), and reliable transportation and stable housing (29.8%, n=17) were the domains with the largest number of participants that reported a score of five or less (Table 3:).
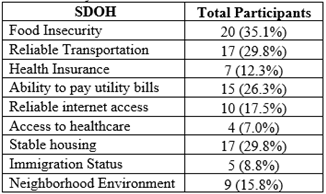 Table 3: Total participants who reported a score of five or less by SDOH domain
Furthermore, five domains (Table 4) had at least one participant that reported a score of one (extremely insecure).
 Table 4: Total participants who reported a score of one (extremely insecure by SDOH domain)
The participants were asked to indicate which of the following, if any, mental health diagnoses they had depression, anxiety, bipolar disorder, eating disorder, or PTSD. Of the 57 participants, 22 (38.6%) had not been diagnosed with any of these mental health disorders, which was the most common response. Responses to this question were not mutually exclusive. Three (5.3%) participants reported a diagnosis of all five disorders (Figure 6).
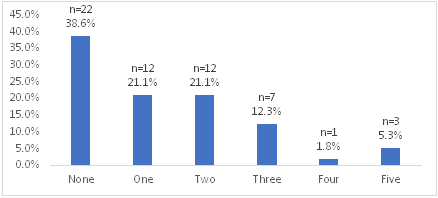 Figure 6: Total participants by number of mental health diagnoses
Of the five mental health diagnoses, depression (49.1%, n=28) was the most common, and bipolar disorder (5.3%, n=3) was the least common (Figure 7).
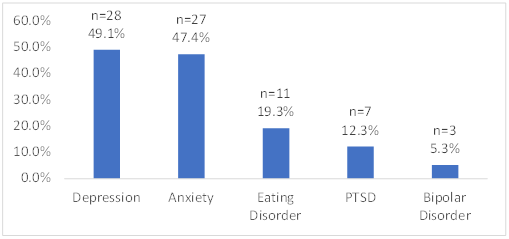 Figure 7: Total participants by reported mental health diagnoses
Depression, bipolar disorder, eating disorders and PTSD were more common in participants who reported more than three ACEs. However, it is interesting to note that anxiety was more common in participants with less than three ACEs, including three participants who reported an ACE score of zero. Table 5 shows the total number of participants by mental health diagnosis and ACE score. Of the 22 participants with three or more ACEs, the majority had depression (86.4%, n=19) and anxiety (72.7%, n=16).
| Total Participants | |||||
|---|---|---|---|---|---|
| ACE Score | Depression | Anxiety | Bipolar Disorder | Eating Disorder | PTSD |
| 0 | 4 (19.0%) | 3 (14.3%) | 0 (0.0%) | 1 (4.8%) | 0 (0.0%) |
| 1 | 2 (28.6%) | 3 (42.9%) | 0 (0.0%) | 1 (14.3%) | 0 (0.0%) |
| 2 | 3 (42.9%) | 5 (71.4%) | 0 (0.0%) | 0 (0.0%) | 1 (14.3%) |
| 3 | 3 (75.0%) | 3 (75.0%) | 0 (0.0%) | 1 (25.0%) | 0 (0.0%) |
| 4 | 1 (100.0%) | 0 (0.0%) | 0 (0.0%) | 0 (0.0%) | 0 (0.0%) |
| 5 | 6 (85.7%) | 4 (57.1%) | 0 (0.0%) | 2 (28.6%) | 0 (0.0%) |
| 6 | 3 (75.0%) | 3 (75.0%) | 0 (0.0%) | 1 (25.0%) | 0 (0.0%) |
| 7 | 3 (100.0%) | 3 (100.0%) | 1 (33.3%) | 2 (66.7%) | 1 (33.3%) |
| 8 | 3 (100.0%) | 3 (100.0%) | 2 (66.7%) | 3 (100.0%) | 3 (100.0%) |
| 9 | 0 (0.0%) | 0 (0.0%) | 0 (0.0%) | 0 (0.0%) | 0 (0.0%) |
| 10 | 0 (0.0%) | 0 (0.0%) | 0 (0.0%) | 0 (0.0%) | 0 (0.0%) |
| 28 | 27 | 3 | 11 | 7 |
Table 5: Total participants by mental health diagnosis and ACE score
What is the prevalence of SDOH in participants diagnosed with anxiety, depression, PTSD, eating disorders, and bipolar disorder?
Interestingly, depression and anxiety were more common in participants with SDOH scores of 50 or higher. PTSD, however, was more common in participants with SDOH scores below 50. Table 6 shows the total number of participants by mental health diagnosis and SDOH score.
| Total Participants | |||||
|---|---|---|---|---|---|
| SDOH Score | Depression | Anxiety | Bipolar Disorder | Eating Disorder | PTSD |
| 30-39 | 2 (100.0%) | 1 (50.0%) | 0 (0.0%) | 0 (0.0%) | 0 (0.0%) |
| 40-49 | 7 (77.8%) | 7 (77.8%) | 2 (22.2%) | 4 (44.4%) | 5 (55.6%) |
| 50-59 | 8 (100.0%) | 6 (75.0%) | 0 (0.0%) | 4 (50.0%) | 2 (25.0%) |
| 60-69 | 10 (31.3%) | 12 (37.5%) | 0 (0.0%) | 2 (6.3%) | 0 (0.0%) |
| 70-79 | 1 (20.0%) | 1 (20.0%) | 0 (0.0%) | 1 (20.0%) | 0 (0.0%) |
| 80-89 | 0 (0.0%) | 0 (0.0%) | 0 (0.0%) | 0 (0.0%) | 0 (0.0%) |
| 28 | 27 | 2 | 11 | 7 |
Table 6: Total participants by mental health diagnosis and SDOH score
Are increased anxiety (GAD-7) and depression (PHQ-9) scores indicative of participants with increased ACE scores?
Although indicated in the study protocol, the GAD-7 and PHQ-9 were not included in the survey. However, participants did indicate if they had ever received a diagnosis of anxiety or depression. A two-sample t-test was performed to compare ACE scores in participants who have been diagnosed with anxiety and those who have not been diagnosed with anxiety. There was a statistically significant difference in ACE scores between the group with an anxiety diagnosis (M = 3.89, SD = 2.69) and those without an anxiety diagnosis (M = 1.20, SD = 1.90); t(55) = -4.39, p < .0001.
A two-sample t-test was performed to compare ACE scores in participants who have been diagnosed with depression and those who have not been diagnosed with depression. There was a statistically significant difference in ACE scores between the group with a depression diagnosis (M = 4.07, SD = 2.65) and those without a depression diagnosis (M = 0.93, SD = 1.53); t(55) = -5.50, p < .0001.
During collection of data, I was fortunate enough that the state Medicaid has set a new requirement to collect data for childhood experiences as part of the Medicaid program. Interestingly enough, that we were going through state survey, with the questionnaire being exactly as the one we prepared for the research that I am doing
Initially it was like my son wanted, but after questioning myself I managed to obtain a clearer idea. It was amazing also that the collection process was very easy. The data was collected from September 2022 till April 2023, with qualified patients after consent and being screened. I have known most of these patients and their families since I have been part of this community for the last 32 years facilitating the data collection process.
The only challenges I have found in some patients’ is that they were not upfront and afraid of telling their problems as clear as it should be. For example, again the grandmother taking care of 6 grandchildren, because her daughter is currently held in jail in Mexico. It is amazing how she is managing life happy with no apparent issues. I see people who I can deem stronger than me, that I extend my own strength to be thankful at the end of the day.
My analysis, and the moral of the story is the challenging task upbringing is in life being, therefore our kids is can become a major issue. Since we are all busy with our phones in today’s age, my son viewed it as the major reason for autism in each one of us, due to have self-isolating ourselves from the world, creating an autistic cochlea for ourselves to isolate with the phone alone, separating ourselves from our kids our society.
In essence happiness is not in a materialistic issue, it’s our duty to create happiness by creating bonds with our families, elderly folk, and children in particular.
Big part of the problem is our self-neglect for the issues that we face but happiness is our self-made events, and we can create it with being present. In the end I decided to go on with my project to create a community center that will host teenage kids at risk, having a therapist, and create art interests in their lives. The community has showed a huge interest by creating the Joseph Camp Foundation in support of the event and progress.
My observation from living here and observing the culture is at the end money didn’t make the happiness for the families here, love and togetherness is what makes life bearable and unique for them. That is the lesson I learned after 30 years of living in the community, searching the culture, and probing the issue. I noticed that if you take the family of 13 members in one house apart, they are not happy alone, but if you make them comfortable, they will be more productive and forcible.
This message was discovered by my deceased son, he figured it out all along as a teenager because he was very savvy, and wise in his small scale. He became close to his troubled friends, and with kindness and encouragement he managed to help changing their life path. In my small scale I’m hoping that I can follow his path in passing my knowledge onto other generations.
Perhaps my small effort becomes seed of happiness search for others.
- References of research paper for Eaton Felitti, V.J, Anda, R.F., Nordenberg, D., Williamson, D.F., Spitz, A.M., Edwards, V., & Koss, M.P. (1998) Relationship of childhood abuse and household dysfunction to many of the leading causes of death in adults: The Adverse Childhood Experiences (ACE) Study. American Journal of Preventive medicine 14(4), 245-258.
- Joining Forces for Children. www.joiningforcesforchildren.org [Internet]. 2020. Available from: http://www.joiningforcesforchildren.org/what-are-aces/