
Article / Original Article
1Research Inst. for Science and Technology, Tokyo University of Science, 2641 Yamazaki, Noda-shi, Chiba-ken 278–8510, Japan
2Faculty Science and Technology, Tokyo University of Science, 2641 Yamazaki, Noda-shi, Chiba-ken 278–8510, Japan
Masashi Nojima
Research Inst. for Science and Technology
Tokyo University of Science
2641 Yamazaki
Noda-shi, Chiba-ken 278–8510
Japan
4 February 2021 ; 19 February 2021
This paper discusses the behaviors of 2-(2-butoxyethoxy) ethanol (DEGBE) as a popular mobile phase for the electrostatic spraying ionization (ESI) processes. We studied behaviors of mass spectrogram respecting to ionization process from electron ionization (EI) and ESI processes installing a quadrupole mass (Q-MS) filter and our originally developed rotating electric fields mass (REF-MS) filter.
MS spectrogram of Q-MS and MS patterns on typical frequencies of the REF-MS were discussed respecting to the MS formations on each process. The MS formations through EI process mainly distribute on fragment or intact ion species and the MS formations by ESI process contain multiple or composite elemental ions. The REF-MS survey different MS dimension comparing to other MS detection methods.
Keywords: Electrostatic spraying ionization (ESI); electron ionization (EI); Rotating electric field mass filter (REF-MS).
Our team has developed two rotating electric fields mass (REF-MS) filter using a novel principle and discussed the performances and potentials as an ion beam mass separator [1, 2]. We first introduced the REF-MS to liquid metal ion sources (e.g., Ga (69Ga+ and 71Ga+ isotopes), AuGe) [3-5]. The REF-MS separates different isotopes, elements and clusters keeping continuous ion beam stream. We have investigated another mass-filtering application on water cluster ion beam generated by vacuum electrospray ionization (V-ESI). The V-ESI methods are evaluating to create a fine focused cluster ion beam for secondary ion mass spectrometry (SIMS) [6-9]. By using the REF-MS, size-controlled water cluster ion beam can be manipulated for micromachining fine structure on polymers and sputtering of different materials [10].
In order to control ionization on electrostatic spraying state, it is important to make clear the physical properties of mobile phases. The electrostatic spraying state can be determined by electro-conductivities, viscosities, surface tensions and vapor pressures of mobile species. Dr. Fujiwara et al., has selected an ionic liquid as a mobile phase and precisely investigated on emitted ions during the ESI process and the interactions of organic materials [11]. Prof. Fujimoto et al., have introduced a nitrate solution of ethanol & 2-(2-butoxyethoxy) ethanol (DEGBE) as a mobile phase and grown calcium cobalt oxide thin film using electrospray deposition (ESD) methods [12]. In this paper, we discussed the behaviors of DEGBE as a popular mobile phase for the electrostatic spraying processes.
The estimations of gas phase in electrostatic spraying state
The mixer of ethanol and DEGBE (1:4) was fixed as mobile phases of this experiment. The mobile phases were introduced to silica capillary; Pico TipTM(30 mmØ, FS360-75-30-D, NEW OBJECTIVE, inc.) with pressured by 5 atm N2 gas. The silica capillary tip can be supplied 10 kV on maximum. We applied ion optical geometries from the focused ion beam (FIB) gun column (FIB30, A & D Company, Ltd.). The extractor (4 mmǾ) is surrounded by a silica capillary tip on the surface. The top of t silica capillary tip shapes Taylor corn and electrospray ions are emitted by differential voltage of extractor. The ions from the V-ESI process can be monitored by 2 different MS detection modes.
One MS detection mode selects ESI environment gas phase by electron ionization (EI) and quadrupole MS (Q-MS) filter (Extorr Inc. XT300M). On an EI sequence, electrons impact environmental gas by 40 eV energy and 2.0 mA current. Q-MS scans from 1–300 amu with the step; 0.1amu and the scanning speed; 1.2 amu/sec. In this detection mode, all ESI ions cannot pass through the Q-MS filter, because ESI ions are excited by the acceleration voltage (Fig. 1). This mode can observe how V-ESI occurs and diffuse from partial pressures of each gas phase on vacuum environments by Q-MS.
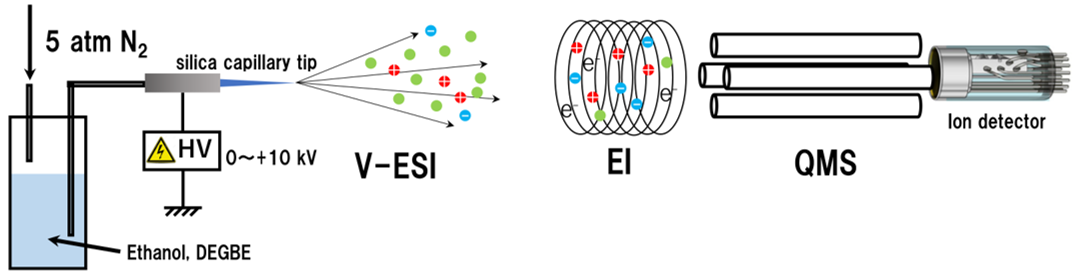
Figure 1: Experimental set-ups for detection of gas phase in electrostatic spraying state. ESI environment gasses are partially ionized by electron ionization (EI) and analyzed by the quadrupole MS (Q-MS) filter (Extorr Inc. XT300M).
The estimations of V-ESI ions by REF-MS
The other MS detection mode separates V-ESI ions by REF-MS. V-ESI ions generated on the top of the silica capillary tip finally focused on a fluorescent screen drawing own MS patterns [4]. The MS patterns are drawn by the REF-MS separated ion trajectories. Typically, V-ESI ions pass through a pair of REFs. The REFs are generated by a pair of octupole suppling phase shifted AC voltage (±210 V). The inside of the REFs, V-ESI ion trajectories are MS separated by the typical frequencies (: f).
This mode can directly detect V-ESI ions by REF-MS. The MS ranges are optimized by only typical frequencies (: f). The f can be defined by a following formula.
![]()
where L is the length of the REF, Vacc is the accelerating voltage of typical ESI ion, m is the mass weight of the ESI ion, e is the quantum of electricity. In principle, the REF-MS can accept free MS range by optimizing only the typical frequency.
The behaviors of gas phase in electrostatic spraying state
Figures 2 indicates MS spectrogram of electron ionized DEG¬BE molecules. DEGBE intact ions appear on 162.1 amu peak on Q-MS spectrogram. Some peaks are identified as fragment peaks from DEGBE molecules. N2 and O2 gas contain as suppression gas and persistent air. The influence of the ethanol mobile phase is unclear on MS spectrogram. By picking up some peaks N2, O2, C2H5O, C4H9 and DEGBE, the relationships between each partial gas pressure and extraction voltages indicate in Fig. 3. The intensities of C2H5O and C4H9 fragments draw sharp peaks on 0.8 kV extraction voltage and rise to constants and increase gently. The sharp peaks are considered to be caused by Columbic expansion during ESI processes [13]. Also, dissolved N2 gas can be appeared by sonic waves of Columbic expansion. There observed a small peak of intact DEGBE on 0.5 kV extraction voltage with good reproducibility. The small peak can generate by different ionization mechanisms from Columbic expansion.
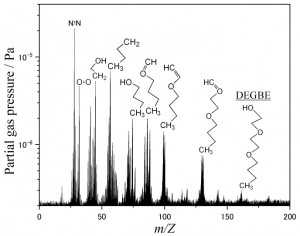 Figure 2: Q-MS spectrogram of ESI environment gas phase of DEGBE. DEGBE intact ions appear on 162.1 amu peak. Some peaks are identified as fragment peaks from DEGBE by the EI process. N2 and O2 gas contain from suppression gas and the air.
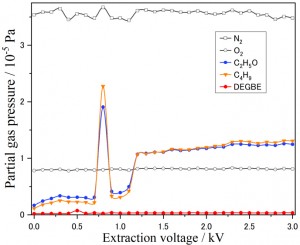 Figure 3: Partial pressures of gas phase in electrostatic spraying state of DEBGE by changing extraction voltage. A sharp peak on C2H5O and C4H9 is contributed to Coulombic expansions in ESI process.
MS patterns drawn by the REF-MS
Figures 4 indicates MS patterns on typical frequencies of the REF-MS. The typical MS weight can be assigned by formula (1). The selected typical frequencies are (a) 270 kHz, (b) 300 kHz, (c) 900 kHz and (d) 1,200 kHz and also assigned MS weight are (a) 1174.5 amu (b) 951.3 amu (c) 105.7 amu and (d) 59.5 amu respectively. We cannot simply compare the values with the result of Fig. 2, because MS patterns by REF-MS are not always drawn by MS orders. The MS patterns rule just focal spots of trajectory- separated ion beams. The trajectories include various phases and terms over revolutions within REFs. At least, the MS patterns indicate the existence of other fragments or molecules on concentric circles.
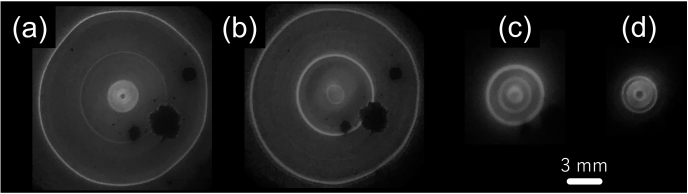 Figure 4: MS patterns on typical frequencies of the REF-MS. The typical frequencies are (a) 270 kHz, (b) 300 kHz, (c) 900 kHz and (d) 1,200 kHz and also assigned MS weight are (a) 1174.5 amu (b) 951.3 amu (c) 105.7 amu and (d) 59.5 amu, respectively.
The diameters of MS patterns become smaller on the frequencies of REF-MS. In fact, the outer diameter of MS pattern on 1,200 kHz has reduced to 20% compared to that on 270 or 300 kHz. This shrink of MS patterns can be explained by the low existing of simple fragment ions of DEBGE on the ESI process. Alternatively, multiple or composite elemental ions on ESI formations drawn complex concentric circles on typical frequencies of 270 or 300 kHz.
We have estimated behaviors of DEGBE on V-ESI gas phases and emitted ions. We also compared MS spectrograms and MS patterns respecting to ionization process from EI and ESI process installing the Q-MS and the REF-MS from different-principal MS filter.
EI exited intact and fragment peaks from DEGBE molecules, suppression gas and persistent air were analyzed by Q-MS. Influences of Columbic expansion were observed by the diagram between some molecular peaks and extraction voltages. MS patterns on typical frequencies of the REF-MS were discussed respecting to the MS formations on each process. The MS formations through EI process mainly distribute on fragment or intact ion species and the MS formations by ESI process contain multiple or composite elemental ions. The REF-MS survey different MS dimension comparing to other MS detection methods.
The authors are particularly indebted to graduated student Mr. Hiroki Hara of Tokyo University of Science and Mr. Tomohiro Shinoda of Yako Sangyo Co. ltd. Also, we appreciate many helpful advices on ESD methods and preparations from Prof. Kenjiro Fujimoto of Tokyo University of science. This unique technique was originally invented by Mr. Masanao Hotta and Dr. Tatsuya Adachi. I wish to express great respect for them. This work was partially supported by academic incentive system of the Toshiba Electric Devices & Storage Corporation.
-
- Masashi Nojima (2019). Printing clear annular patterns by mass separated ion using rotating electric fields. Nanotechnol Adv Mater Sci, 2, 1.
- Yuki Anai, Masashi Nojima, Masanao Hotta, Satoshi Kurumi, Kaoru Suzuki, Tatsuya Adachi, Takashi Kusanagi, and Kosuke Moritani (2016). Development of mass spectrometer using two rotating electric fields for separation of high-mass ions. e-J. Sci. Nanotech, 14, 161. doi: https://doi.org/10.1380/ejssnt.2016.161
- Masashi Nojima, Yuki Anai, Masanao Hotta, Satoshi Kurumi, Kaoru Suzuki, Tatsuya Adachi, Takashi Kusanagi, and Kosuke Moritani (2016). Development of a mass spectrometer using two rotating electric fields. J Vac Sci Technol B, 34, 3. doi: https://doi.org/10.1116/1.4944838
- Masashi Nojima, Tokio Norikawa and Naoya Kishimoto (2018). Mass separation of AuGe-LMIS using a new principle: Rotating electric fields. Mass Spectrom Purif Tech, 4, 2. doi: https://doi.org/10.4172/2469-9861.1000128
- Masashi Nojima (2017). Imaging mass spectrogram using rotating electric fields mass spectrometer. Glob J Nanomed, 2, 5. doi: 10.19080/GJN.2017.02.555596
- Satoshi Ninomiya, Lee Chuin Chen, Yuji Sakai, Hiroaki Suzuki, and Kenzo Hiraoka (2013). Development of a high-performance electrospray droplet beam source. Surf Interface Anal, 45, 126. doi: https://doi.org/10.1002/ sia.4907
- Satoshi Ninomiya, Yuji Sakai, Lee Chuin Chen, and Kenzo Hiraoka (2018). Development of a vacuum electrospray droplet ion gun for secondary ion mass spectrometry. Mass Spectrometry, 7, 69. doi: https://doi.org/10.5702/ massspectrometry.A0069
- Satoshi Ninomiya, Lee Chuin Chen, and Kenzo Hiraoka (2018). Relative secondary ion yields produced by vacuum-type electrospray droplet ion beams. J Vac Sci Technol B, 36, 3. doi: https://doi.org/10.1116/1.5019182
- Yuji Sakai, Satoshi Ninomiya, and Kenzo Hiraoka (2017). Sputtering properties for polyimide by vacuum electrospray droplet impact (V-EDI) using size-selected cluster ions. Surf Interface Anal, 49, 127. doi: https://doi. org/10.1002/sia.6070
- Masashi Nojima, Hiroto Mita, Kazuki Hara (2020). Mass separation of water cluster ion beam using two rotating electric fields and sputtering of a polymer thin film. e-J. Surf. Sci. Nanotech, 18, 101. doi: https://doi.org/10.1380/ ejssnt.2020.101
- Yukio Fujiwara, Naoaki Saito (2018). Secondary ion mass spectrometry (SIMS) of organic samples using ionic liquids. Vacuum and Surface Science, 61(7) 446. doi: https:// doi.org/10.1380/vss.61.446
- Kenjiro Fujimoto, Takuto Isa, Haruka Sakurai, Yuki Yamaguchi, Keishi Nishio, and Shigeru Ito (2015). Preparation and evaluation of Ca3 (Co, M)4 O9+δ type thermoelectric material by electrostatic spray deposition method. J. Jpn. Soc. Powder Powder Metallurgy, 62 (4), 175. doi: https://doi.org/10.2497/jjspm.62.175
- Keqi Tang1, Richard D.Smith (1999). Theoretical prediction of charged droplet evaporation and fission in electrospray ionization2. International Journal of Mass Spectrometry, 185–187 (29), 97. doi: https://doi.org/10.1016/ S1387-3806(98)14107-6.