Article / Review and Synthesis
Huffington Foundation Professor of Economics and Environmental Studies, Emeritus Wesleyan University Middletown, CT 06459.
Gary Yohe,
Huffington Foundation Professor of Economics and Environmental Studies,
Emeritus Wesleyan University Middletown,
CT 06459
1 November 2024 ; 16 November 2024
On February 1st of 2022, Lancet did itself proud by publishing a spectacular paper from the COVID-‐19 National Preparedness Collaborators (NPC) (Bollyky et al., 2022). More than 100 authors have therein reconfirmed that analysis of COVID shines a light onto the character of societies around the world as they rise to meet the challenges of a significant external force. Moreover, their work contributes to another literature – the ensemble of parallel analyses of how humanity might respond to the existential risks born of climate change, and that is the point of this correspondence.
It has become noticeably evident over the past several years that time dimensions of drivers and impacts are the only fundamental differences between analyses of a global pandemic like COVID-‐19 and a global threat climate change (Yohe, 2020). For present purposes, call this Hypothesis #1. It is anchored on two parallel practical facts. On the one hand, the mortality and morbidity risks of a pandemic put humanity in harm’s way along time scales that are measured in days, 7-‐day intervals, months, and years; and human responses are designed to reduce those risks by either lowering the likelihood of an individuals’ being infected or the consequences of such an infection. On the other hand, the human and economic risks of climate change put humanity and its posterity at risk along scales that are measured in seasons, 5 to 10 year trends, decades, and centuries; and current responses to a very long term problem are designed to reduce either the likelihood of specified levels of warming or the consequences of coping with the resulting impacts. To summarize, the choices in either context are three: abate (mitigate in the climate jargon), adapt, or suffer.
Thinking the adaptation choice in the climate change arena has been formalized by expressing vulnerability to climate risks (V) as a potentially complex and site-‐specific function of exposure (E) and sensitivity (S) (Yohe &Tol, 2002). Both of these vectors were themselves seen to be functions of adaptive capacity (AC) – an invention of the authors of Chapter 18 (“Adaptation”) in the contribution of Working Group II to the Third Assessment Report of the Intergovernmental Panel on Climate Change (Bollyky et al., 2022). It is appropriate for present purposes to assume, as Hypothesis #2. That V would increase with an increase in any component of the vector E at an increasing rate while, in accordance with Hypothesis #3, it would decline with at an increasing rate with the increase of any component of vector S.
In its formal structure, AC was taken to be a secondary function of N site-‐specific and not-‐necessarily independent multivariate “determinants” (D1, …., DN):
V = f {E (AC); S (AC)} where AC = g {D1; ….; DN}(Yohe, 2020).
An up-to‐date version of the established determinants of the adaptive capacity (and the analogous mitigative capacity) of societies to respond to an external stress can include:
D1:the availability to response options available to society, including risk spreading mechanisms,
D2 – the availability to resources and the character of their distributions across the relevant population,
D3 – the strength and credibility of society’s critical decision-‐ and opinion-‐making institutions and their decision criteria,
D4 – the stock of human capital across the population, including educational achievement and personal security,
D5 – the stock of social, political-‐economic and legal capital across the society,
D6 – the ability of society’s decision-‐ and opinion-‐makers to comprehend, manage, and communicate dynamic sources of evolving information and maintain their credibility across the population, and
D7 – the public’s perception of the sources of the external stressors and the significance of that stress in determining exposure and sensitivity to their manifestations.
This thread in the literature quickly expanded in its real-world applicability by advancing Hypothesis #4 that the overall capacity to adapt to (or mitigate against) the manifestations of an external stress would depend most significantly on the weakest of the underlying determinants (Tol &Yohe, 2007). Many have nonetheless argued that this formalization implies that policies and actions to strengthen any determinant Di can be viewed as potentially effective climate policy.
Turning now to the value of the NPC article in understanding how best to design the response domain for climate change risks wherein 30 consensus words published by the IPCC have been widely accepted as the appropriate framing: “Responding to climate change involves an iterative risk management process that includes both adaptation and mitigation and takes into account climate change damages, co-‐benefits, sustainability, equity and attitudes toward risk” (Pachauri et al., 2007). It is productive, in this effort, to apply the formalization of adaptive capacity with respect to climate risks across the interface. Quite simply, “infections per capita” can be thought of as exposure E while the “infection fatality ratio” (IFR) reflects sensitivity S.
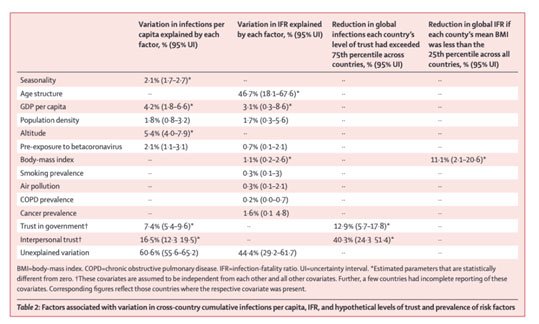
Table 1: Factors associated with variation in infections per capita, infection fatality ratio, trust, a risk prevalence.
Source: Table 2 in Bollyky, et al (2022)
Notice, first of all, that the explanatory variables for variation in E and S across the cross-‐sectional data that has been analyzed by the NPC can be easily placed within the boundaries of one or more of the determinants listed in the climate context. From their Table 2 replicated here as Table 1, for example, “GDP per capita” fits inside D2, “trust in government” touches base with D7, while “interpersonal trust” reflects D4. Except for “seasonality”, all of the significant explainers of variation in E can find a home in the climate change approach.
Their column for S (IFR) picks up only D2 through per capita GDP. The remaining entries in the second column are fundamentally health factors that affect personal security, and so they lie within the vector for D4. In their Table 3, “pandemic preparedness” indicators belong to D1 and D3, “health care capacity” indicators populate D1 and D2, “governance indicators” link to D3, D5, and D7, while “social indicators” fit into D2, D4, D6, and D7. Their Figure 4 replicated here as Figure 1 correlates elements of the D1 vector (where response options include mobility and vaccination) with the three significant indicators of D7 (“trust in government”), D4 (“interpersonal trust”), and D5 (“government corruption”). It would appear that the authors of NPC have organized their analysis and their communication of results in ways that are entirely consistent with Hypotheses #1.
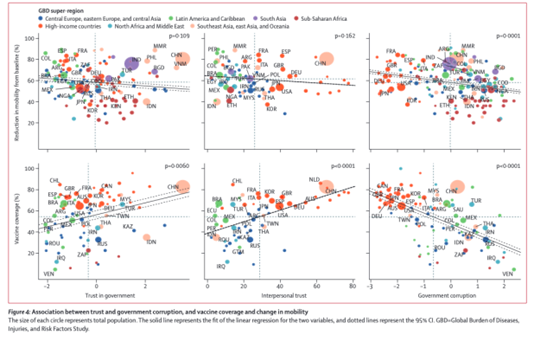
Figure 1: Association between trust and government corruption with both vaccine coverage and changes in mobility.
Source: Figure 4 in Bollyky, et al (2022)
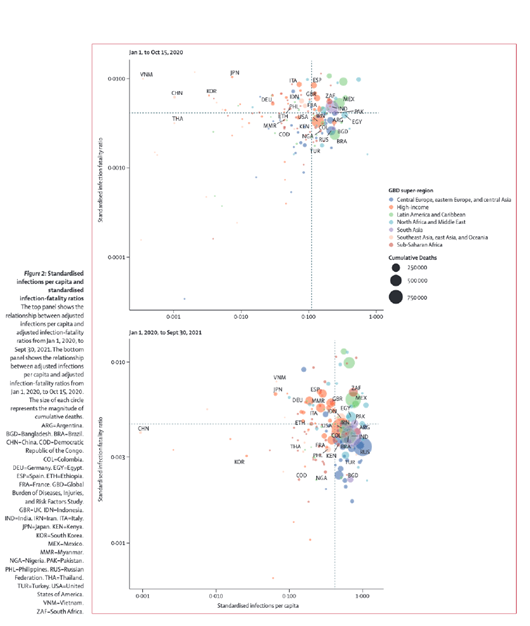
Figure 2: Source: Standardized infections per capita and infection-fatality ratios.
Source: Figure 2 in Bollyky, et al (2022)
Consistent with the implications of Hypotheses #2 and #3, their Figure 2 replicated here also as Figure 2, shows a negative correlation between E and S that is especially strong when the months between October 15, 2020 and September 30, 2021 are included (note: the caption incorrectly identifies the two panels even though their headings are correct).
Finally, the major conclusions reported by the authors bear witness to the applicability of the “weakest link” interpretation of Hypothesis #4:
Policy-makers and opinion-makers cannot influence many of contextual factors that explain variation in both E and S.
Important indicators used to construct health care capacity and preparedness indices are not correlated in cross-‐sectional variation in either E and S.
Trust in government and other people are significant in explaining variation in E but not S.
Vaccinations may be the mechanism behind the significance of the trust conclusions.
In summary at a macro scale, then, trust is the weakest link in the pandemic context. That is, NPC have shown that lack of trust is the primary obstacle to reducing health risk from COVID-19 (by lowering likelihood of exposure and/or is consequences through contextual factors), and that is alarming. Confidence in the climate change assessment sense in this finding should be very high because it was produced from very careful, copious, and comprehensive analysis of an existential health threat for all of humanity. By virtue of the strength of the COVID-climate analogy described here and this high confidence, the NPC work also casts some significant shade on the hope that climate change interventions will work well without our somehow rebuilding trust in our understanding of the climate-‐socioeconomic-‐political climate system across public and private sectors.
It therefore follows from the analogy between COVID risk and climate change risk that actions designed to improve trust in either domain should benefit both because they would help strengthen the weakest link in both response domains. Two corollaries also emerge. First, confidence in Hypothesis #1 is another reason why improved collaboration across the health-climate interface would be valuable in developing and applying modeling and measurement techniques in support of ensemble projections and counterfactual exercises. Secondly, Hypotheses #2 through #4 mean that increased collaboration on ways to transparently preserve and communicate the credibility of the science between the two domains will further support of productive public discourse.
- Bollyky, T., Hulland, E., Barber, R. M., Collins, J. K., Kiernan, S., Moses, M., Pigott, D. M., Reiner, R. C., Sorensen, R. J. D., Cristiana, A., Adolph, C., Allorant, A., Amlag, J. O., Aravkin, A., Bang-Jensen, B., Carter, A. R., Castellano Id, R., Castro, E., Chakrabarti, S. …….. & Dieleman, J. L. (2022). Pandemic preparedness and COVID-‐19: An Explanatory Analysis of Infection and Fatality Rates, and Contextual Factors Associated with Preparedness in 177 Countries, from Jan 1, 2020, to Sept 20, 2021. Lancet, 399(10334), https://www.thelancet.com/pdfs/journals/lancet/PIIS0140-6736(22)00172-6.pdf
- Yohe, G. (2020). On the Value of Conducting and Communicating Counterfactual Exercises: Lessons from Epidemiology and Climate Science. In S. Sarvajayakesavalu, & P. Charoensudjai, (Eds). Environmental Issues and Sustainable Development: Sustainability, Intech Open DOI: 10.5772/intechopen.93639
- Yohe, G & Tol, R. S. J. (2002). Indicators for Social and Economic Coping Capacity – Moving Toward a Working Definition of Adaptive Capacity. Global Environmental Change 12(1), 25-40. https://www.start.org/Projects/AIACC_Project/meetings/Norwich_02/Norwich_CD/APPENDICES/ARTICLES_VULN_ADAPTCAP/INDIC_SE_ADAPTCAP.PDF
- Tol, R. S. J., & Yohe, G. (2007). The weakest link hypothesis for adaptive capacity: An empirical test. Global Environmental Change, 17, 218-‐227. https://gyohe.faculty.wesleyan.edu/files/2018/05/80.pdf
- Pachauri, R., Rajendra, K., & Reisinger, A. (Eds.). (2007). Climate change 2007: Synthesis Report. Contribution of Working Groups I, II, and III to the Fourth Assessment Report of the Intergovernmental Panel on Climate Change, IPCC, Geneva, Switzerland, 104. https://research.usq.edu.au/item/q6wy0/climate-change-2007-synthesis-report-contribution-of-working-groups-i-ii-and-iii-to-the-fourth-assessment-report-of-the-intergovernmental-panel-on-climate-change


