Article / Research Article
eclaireMD Foundation, USA
Gerald C. Hsu
eclaireMD Foundation, USA
29 September 2020 ; 17 October 2020
The author utilizes quantitative analysis results based on diabetes control for two periods: the pre-COVID-19 period, from 5/5/2018 to 1/18/2020, and the COVID-19 period, from 1/19/2020 to 8/25/2020, within a duration of 2.3 years. Special attention has been placed on the comparison of quantitative glucose results, including FPG, PPG, daily glucose, and HbA1C, especially the COVID-19 quarantine period from 1/19/2020 to 8/25/2020.
From his collected big data, it is obvious that the COVID-19 period has lower glucose values which are expressed in the following format, all in the unit of mg/dL: (pre-period, COVID-19 period, glucose difference).
Finger FPG : (113, 105, -8)
Finger PPG : (116, 110, -6)
Finger daily glucose : (115, 109, -6)
Sensor FPG : (113, 105, -8)
Sensor PPG : (136, 124, -12)
Sensor daily glucose : (131, 119, -12)
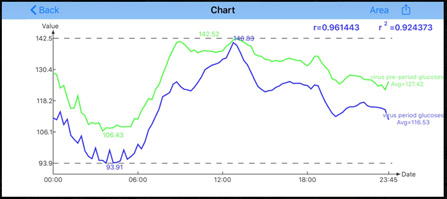
In the chart above, it is evident that these two synthesized daily glucose waveforms (within 24 hours at 15 minutes for each time interval) are very similar in shape with an extremely high correlation coefficient of 96%. This means that his lifestyle details, including meal, exercise, sleep, and other factors are quite similar, where they follow the same routine. However, the amplitude of the pre-COVID-19 waveform (green curve) at each time instant is higher than the COVID-19 waveform (blue curve). This indicates that the intensity or amount of his lifestyle detailed items during the COVID-19 period are much healthier prior to this timeframe.
The COVID-19 virus is the worst epidemic in recent human history in terms of its spreading speed, fatality number, and emotional impact on the world population. People belonging to the “vulnerable” groups, such as the elderly with history of or existing chronic diseases and complications, require special consideration to their health conditions as well as lifestyle management program during this period. However, the author has achieved even better results on his diabetes control in terms of FPG, PPG, daily glucose, and HbA1C values. The knowledge and experience he has acquired in the past 10 years of medical research and his developed mathematical metabolism index model and four diabetes prediction tools have assisted him in many ways. More importantly, the quiet, stable, and undisturbed lifestyle during this timeframe does contribute to his better glucose control situation. As a result, he has achieved an overall lower glucose values and a lower HbA1C value prior to the pre-COVID-19 period. In fact, he turned the COVID-19 crisis into his health advantage!
To learn more about the GH-Method: math-physical medicine (MPM) methodology, readers can review the article to understand his MPM analysis method in reference 1 [1], along with the outlined history of his personalized diabetes research and application tools development in reference 2 [2].
During 2015 and 2016, he dedicated his time to research four prediction models related to his diabetes measurement conditions such as weight, postprandial plasma glucose (PPG), fasting plasma glucose (FPG), and HbA1C (A1C). As a result from using his own developed metabolism model and 4 prediction tools, by the end of 2016, his weight reduced from 220 lbs. (100 kg) to 176 lbs. (89 kg), waistline from 44 inches (112 cm) to 33 inches (84 cm), average finger glucose value from 280 mg/dL to 120 mg/dL, and A1C from 10% to ~6.5%. One of his major accomplishments is that he no longer takes any diabetes medications since 12/8/2015.
In 2017, he had achieved excellent results on all fronts, especially glucose control. However, during 2018 and 2019 (overlapping the pre-COVID-19 period), he traveled to 50+ international cities to attend 60+ medical conferences and made ~120 oral presentations. The hectic schedule inflicted damage to his diabetes control, through dinning out along with exercise disruption, and on the overall metabolism status due to irregular life routines through traveling.
Since 1/1/2012, the author measured his glucose values using the finger-piercing method: once for FPG and three times for PPG each day. In the finger glucose database, FPG occupies 25% of daily glucose while PPG occupies 75% of daily glucose. On 5/5/2018, he applied a continuous glucose monitoring (CGM) sensor device on his upper arm and checked his glucose measurements every 15 minutes, a total of ~96 times each day. After the first bite of his meal, he measured his postprandial plasma glucose (PPG) level every 15 minutes for a total of 3-hours or 180 minutes. He has maintained the same measurement pattern since 5/5/2018 until present day. In this CGM sensor glucose database, FPG occupies 29% of daily glucose, PPG occupies 38% of daily glucose, and pre-meals plus pre-bed periods occupies 33% of his daily glucose.
As indicated in the “Linkage among metabolism, immune system, and various diseases using GH-Method: math-physical medicine (MPM)”, the most effective defensive protection against COVID-19 is our immune system [3]. The immune system is closely related to the overall metabolic conditions. We can safely say that metabolism and immunity are two sides of one coin. In order to strengthen our overall metabolism, we must manage our daily lifestyle to build up a strong and firm foundation over a long period of time.
In short, lifestyle is similar to the product quality and production capacity of an arsenal based on the overall educational, technological, and industrial power, whereas metabolism is similar to the effectiveness and destruction power of the weapons available to soldiers which are produced by an arsenal. Immunity is similar to the overall military strength of the armed defense force (assembly of soldiers with weapons), while diseases (chronic, cancer, and infectious) are similar to an enemy’s invasion force. Lastly, the study of death is similar to the investigation of outcomes of a war, which is the probability and rate of death [4].
In Figure 1, it shows the background data table of his glucose components comparison between the pre-COVID-19 period (5/5/2018 – 1/18/2018, 623 days with 1,934 meals) and COVID-19 period (1/19/2020 – 8/25/2020, 219 days with 660 meals). This data table contains PPG data, FPG data, daily glucose data, and HbA1C values. All of these glucose data group contains two datasets, finger-piercing tested PPG, and CGM sensor measured PPG.
 Figure 1: Summary data table
From Figure 2 and Figure 3, it is obvious that the COVID-19 period has lower glucose values during this timeframe which are expressed in the following formats, in the unit of mg/dL: (pre-period, COVID-19 period, and glucose difference).
Finger FPG: (113, 105, -8)
Finger PPG: (116, 110, -6)
Finger daily glucose: (115, 109, -6)
Sensor FPG: (113, 105, -8)
Sensor PPG: (136, 124, -12)
Sensor daily glucose: (131, 119, -12)
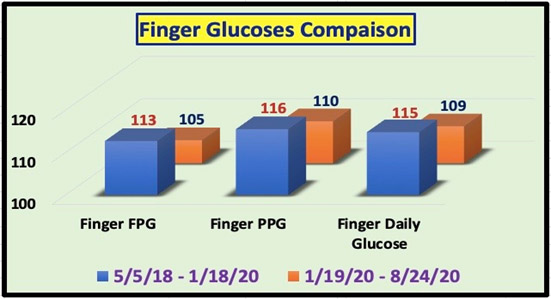 Figure 2: Comparison of Finger glucoses between two periods
 Figure 3: Comparison of Sensor glucoses between two periods
The most important and conclusive chart is shown in Figure 4: the direct comparison between two synthesized daily glucose waveforms, with the average total daily glucose curves at each time interval of 15 minutes, total 96-time instants for both pre-COVID-19 period and COVID period.
In Figure 4, it is obvious that these two daily glucose waveforms are very similar in shape, with an extremely high correlation coefficient of 96%. This means that his lifestyle details, including meal, exercise, sleep, and other factors are quite similar and follow the same routine. However, the amplitude of pre-COVID-19 period waveform (green curve) at each time instant is higher than the COVID-19 period waveform (blue curve). This means that the intensity or amount of his lifestyle detailed items during COVID-19 period are much healthier prior to this timeframe.
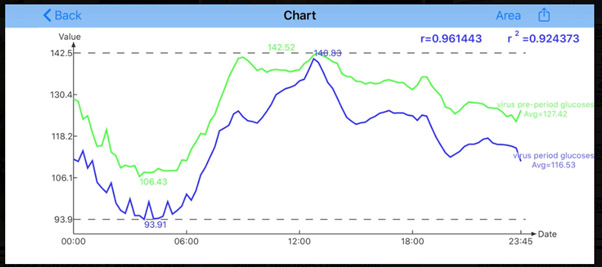 Figure 4: Comparison of daily glucose waveforms (24 hours) between two periods
As mentioned in the section of “Method”, finger PPG occupies 75% of daily finger glucose value while sensor PPG occupies 38% of daily sensor glucose value; therefore, special interest should be placed on PPG comparison (Figure 5).
 Figure 5: Comparison of PPG synthesized waveforms of two periods.
The following list depicts some actual values of these two periods in the order of “finger PPG value, sensor average PPG, carbs/sugar amount in grams, post-meal walking steps, finger daily glucose, and sensor daily glucose”.
Pre-COVID-19 Period (5/5/2018 – 1/18/2020):
116 mg/dL, 136 mg/dL, 14.6 grams, 4,284 steps, 115 mg/dL, 131 mg/dL
COVID-19 Period (1/19/202 – 8/24/2020):
110 mg/dL, 124 mg/dL, 12.2 grams, 4,290 steps, 109 mg/dL, 119 mg/dL
Here are the key findings of the following 6 items regarding influential factors of glucose related to his lifestyle management details during COVID-19 period:
- Carbs/sugar amount: The difference of 2.4 grams would contribute about 4 to 5 mg/dL on finger PPG difference. This is mainly due to his home cooked meals without dining out during this period. He also maintained high-quality protein with nutritional balanced diet.
- Exercise: This factor can be ignored since he sustained an almost equal level of post-meal walking steps during these two periods (4,284 steps for pre-COVID-19 vs. 4,290 steps for COVID-19). His daily walking steps are approximately 16,000 steps.
- Ambient weather temperature: This factor can also be disregarded since both periods cover colder temperature in winter and warmer temperature in summer. The average ambient weather temperatures are 74° Fahrenheit for pre-COVID-19 period and 71° Fahrenheit for COVID-19 period.
- No traveling and jet lag during this virus timeframe.
- Stress-free life during this virus timeframe by focusing on his medical research work and avoiding the emotional disturbance from news associated with current politics and COVID-19 fatalities.
- Sleep: He has maintained 7 to 8 hours of good quality sleep every night during this virus period.
The lifestyle details from above have kept his PPG within a healthy level without the involvement of medications.
It should be mentioned that his pancreatic beta cells have been self-repaired at an approximately 2.2% to 3.2% annual rate since 2014 [6]. Therefore, this special “insulin improvement” effect on his overall control of glucose conditions cannot be overlooked.
In Figure 6, it shows the mathematically predicted HbA1C values of both finger glucose based and sensor glucose based during these two periods. The pre-COVID-19 period has HbA1C values of 6.7% to 6.8% and the COVID-19 period has HbA1C value of 6.4%. Therefore, the HbA1C difference between the two periods is 0.3% to 0.4% [5].
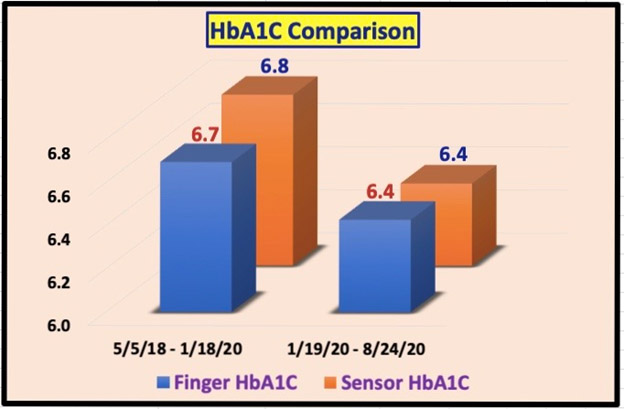 Figure 6: Comparison of two periods’ mathematically predicted HbA1C values from both finger based and sensor based.
The COVID-19 virus is the worst epidemic in recent human history in terms of its spreading speed, fatality number, and emotional impact on the world population. People belonging to the “vulnerable” groups, such as the elderly with history of or existing chronic diseases and complications, require special consideration to their health conditions as well as lifestyle management program during this period. However, the author has achieved even better results on his diabetes control in terms of FPG, PPG, daily glucose, and HbA1C values. The knowledge and experience he has acquired in the past 10 years of medical research and his developed mathematical metabolism index model and four diabetes prediction tools have assisted him in many ways. More importantly, the quiet, stable, and undisturbed lifestyle during this timeframe does contribute to his better glucose control situation. As a result, he has achieved an overall lower glucose values and a lower HbA1C value prior to the pre-COVID-19 period. In fact, he turned the COVID-19 crisis into his health advantage!
- Gerald C. Hsu (2020). eclaireMD Foundation, USA. Biomedical research methodology based on GH-Method: Math-physical medicine.
- Gerald C. Hsu (2020). eclaireMD Foundation, USA. Glucose trend pattern analysis and progressive behavior modification of a T2D patient using GH-Method: Math-physical medicine.
- Gerald C. Hsu (2020). Linkage among metabolism, immune system, and various diseases using GH-Method: Math-physical medicine (MPM). Journal of Biotechnology and Immunology, 2(3).
- Gerald C. Hsu (2020). eclaireMD Foundation, USA. Building up fundamental strength to fight against COVID-19 for patients with chronic diseases and complications.
- Gerald C. Hsu (2020). A case study on the prediction of a1c variances over seven periods with guidelines using GH-Method: Math-physical medicine. OSP Journal of Health Care and Medicine (HCM), 1(2).
- Gerald C. Hsu (2020). eclaireMD Foundation, USA. Self-recovery of pancreatic beta cell’s insulin secretion based on annualized fasting plasma glucose, baseline postprandial plasma glucose, and baseline daily glucose data using GH-Method: Math-physical medicine.