
Article / Short Communication
eclaireMD Foundation, USA
Gerald C. Hsu
eclaireMD Foundation, USA
3 August 2020 ; 3 September 2020
The author uses GH-method: math-physical medicine (MPM) approach to investigate three sets of correlation between:
- Weight vs. Metabolism Index
- Glucose vs. Metabolism Index
- Weight vs. Glucose – Weight is measured in early mornings and Glucose consists of daily average glucose, including both fasting plasma glucose (FPG) and three postprandial plasma glucose (PPG).
He utilized time-series analysis on both his “daily data” and his “annual data” for comparison. His selected study period was 8.5 years (3,124 days) from 1/1/2012 through 7/23/2020. The reason for this specific time period was due to his weight (M1) and glucose (M2) data collection starting on 1/1/2012 along with the calculation of his metabolism index (MI) values.
It is clear that, through his sophisticated math-physical medicine of metabolism and then statistical method of time-series analysis, all of these three biomarkers, weight, glucose, and metabolism index are proven to be highly correlated to each other.
The following order ranking of correlation coefficients remained to be true between daily data and annual data:
M1&MI > M2&MI > M1&M2
Daily : 84% > 72% > 61%
Annual : 91% > 81% > 67%
In other words, if you manage your metabolism (4 medical conditions and 6 lifestyle details) by controlling your disease conditions and monitoring your lifestyle details, your body weight and glucose will reduce accordingly.
The author’s analyses is based on his personal biomarkers of two million data within 8.5 years (3,124 days) has further proven a simple and clean conclusion that has already been observed by many clinical physicians and healthcare professionals from their patients.
The author uses GH-method: math-physical medicine (MPM) approach to investigate three sets of correlation between:
- Weight vs. Metabolism Index
- Glucose vs. Metabolism Index
- Weight vs. Glucose – Weight is measured in early mornings and Glucose consists of daily average glucose, including both fasting plasma glucose (FPG) and three postprandial plasma glucose (PPG).
He utilized time-series analysis on both his “daily data” and his “annual data” for comparison. His selected study period was 8.5 years (3,124 days) from 1/1/2012 through 7/23/2020. The reason for this specific time period was due to his weight (M1) and glucose (M2) data collection starting on 1/1/2012 along with the calculation of his metabolism index (MI) values.
The purpose of this study is two-fold: first, to investigate the degree of closeness between two basic biomarkers, and second, to see the trend of movement for each biomarker. If two biomarkers are moving upward or downward in unison, then they have a high correlation coefficient R. A correlation coefficient is a numerical measure of some type of correlation, meaning a statistical relationship between two variables. In most cases, the correlation coefficient can only be calculated by two sets of data, and more conveniently via a time-series analysis (i.e. x-axis is time and y-axis is the biomarker’s amplitude). By using the 90-days moving average daily data for his graphic presentation, this provides a better viewing. The following expressions are the “time-series” functions:
- Function A = f(t)
- Function B = f(t)
For his datasets, he has decided to use two approaches. The first approach, for data completeness, he uses the entire period’s daily data of 3,124 days for his calculation and graphic presentation. The second approach, for matching with some general medical practices, he uses nine sets of the annualized average data of 8.5 years for his calculation and graphic presentation. For the year 2020, the data reflects from 1/1/2020 through 7/23/2020.
Due to the vast amount of data, the calculated correlation coefficient is usually lower than the annual data. Actually, this annual data operation is composed of two stages of calculation. The first step is to calculate the annual average and the second step is to calculate the annual correlation. Therefore, the annual data calculated correlation coefficient is usually higher than the daily data.
If any correlation coefficient (R) is greater than 50%, then it indicates that these two biomarkers are closely related, or highly correlated.
In this study, the author used a “normalized” value to describe weight and glucose, instead of using the “real” measured data in units of pounds and mg/dL. His target value for each of these two biomarkers are:
M1 (Weight): 170 lbs. (BMI at 25.0)
M2 (Glucose): 120 mg/dL (the dividing line for diabetes)
His M1 and M2 values are defined as follows:
m1 = measured weight / 170
m2 = measured glucose / 120
Next, he will explain his definition of this metabolism index (MI).
He spent the entire year of 2014 to search and define 10 categories of metabolism (containing 500 detailed elements within these 10 categories), including 4 outputs of physiological symptoms or medical conditions, such as obesity, diabetes, hypertension, and hyperlipidemia, with 6 inputs of lifestyle details or healthy habits, such as food quantity control and nutritional balance, water intake, persistent exercise, sufficient sleep, stress reduction, and daily life routines. These ten categories are interwound together and have a kind of “n by n” (actually 6 categories by 4 categories) nonlinear mathematical relationships. He then applied the concept of topology of mathematics and the modeling technique of finite element method of structural and mechanical engineering to develop a mathematical model of metabolism index (MI) in 2014. This MI value is a complex combination of existing medical conditions and lifestyle habits. It is an indication of overall health status of one person. The author further defined a new term, the metabolism index (MI) to numerically show a person’s overall health state. If the individuals’ MI is below 73.5%, then they are healthy; otherwise, if above 73.5%, they are unhealthy. This MI is a “dynamic” value since it changes continuously during a day or within a long period which depends on inputs of disease conditions and lifestyle details.
The author will provide a brief explanation regarding his mentioned mathematical and engineering tools. First, “topology” is the mathematical study of the properties that are preserved through deformation, twisting, and stretching of objects. The human body and its organs are such systems. The second, “finite element method” is to divide a system into a finite number of smaller elements, which includes a study of individual properties and behaviors first and then an operation of combining them back together in order to get an approximate solution of the total system’s behavior.

Figure 1: Time-series of daily data
Figure 1 shows the results of using his daily data for the past 8.5 years. Specifically, the time-series analysis results shows the comparison of three correlation coefficients (R) from these three “daily” datasets of dual-biomarkers time-series as follows:
M1 (weight) vs. MI
R = 84%: weight & MI are highly correlated
M2 (glucose) vs. MI
R = 72%: glucose & MI are highly related
M2 (glucose) vs. M1 (weight)
R = 61%: glucose & BP are moderately related.
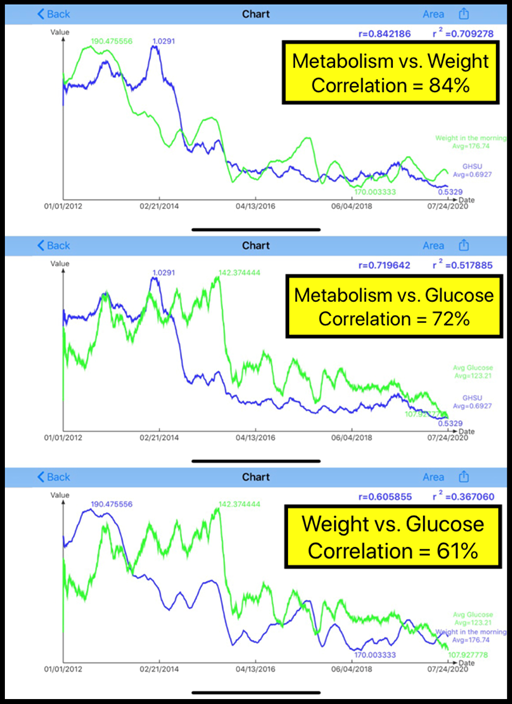
Figure 2: Time-series of annual data
Figure 2 depicts the comparison of three correlation coefficients (R) from these three “annual” datasets of dual-biomarkers time -series analysis as follows:
M1 (weight) vs. MI
R = 91%: weight & MI are highly correlated
M2 (glucose) vs. MI
R = 81%: glucose & MI are highly related
M2 (glucose) vs. M1 (weight)
R = 67%: glucose & BP are moderately related.
These annual comparison results have a higher correlation coefficients than the daily comparison results.
However, the following order ranking of R are the same between daily and annual datasets:
M1&MI > M2&MI > M1&M2
Daily: 84% > 72% > 61%
Annual: 91% > 81% > 67%
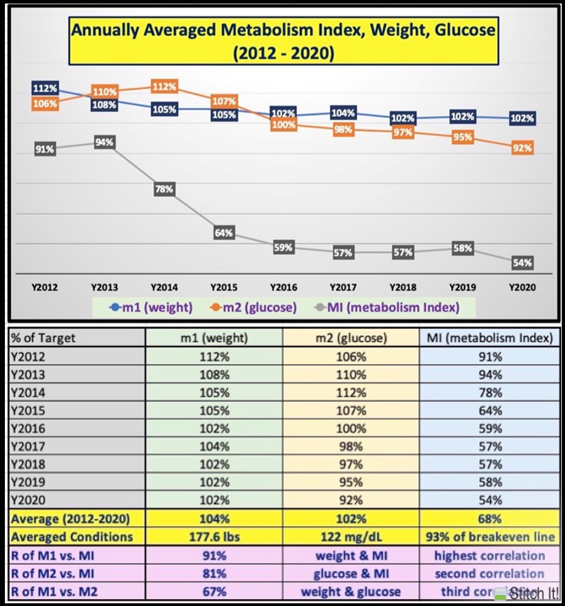
Figure 3: Annual Data Table and Line Chart of Weight, Glucose, and Metabolism Index
Figure 3 illustrates the data table and line chart of M1 (weight), M2 (glucose) and MI (metabolism index).
It is clear that, through his sophisticated math-physical medicine of metabolism and then statistical method of time-series analysis, all of these three biomarkers, weight, glucose, and metabolism index are proven to be highly correlated to each other.
The following order ranking of correlation coefficients remained to be true between daily data and annual data:
M1&MI > M2&MI > M1&M2
Daily: 84% > 72% > 61%
Annual: 91% > 81% > 67%
In other words, if you manage your metabolism (4 medical conditions and 6 lifestyle details) by controlling your disease conditions and monitoring your lifestyle details, your body weight and glucose will reduce accordingly.
The author’s analyses is based on his personal biomarkers of two million data within 8.5 years (3,124 days) has further proven a simple and clean conclusion that has already been observed by many clinical physicians and healthcare professionals from their patients.
- Hsu, Gerald C (2020) “Clinic Case A using big data analytics and spatial analysis to investigate the triangular dual-correlations among weight, glucose, blood pressure via GH-Method: math-physical medicine (No. 041).”
- Hsu, Gerald C (2020) “Using GH-Method: math-physical medicine to investigate the triangular dual-correlations among weight, glucose, blood pressure with a Comparison of 2 Clinic Cases (No. 043).”
- Hsu, Gerald C (2020) “Using GH-Method: math-physical medicine to investigate the HbA1C’s role in triangular relationships among HbA1C, Weight, and Blood Pressure (No. 55).”
- Hsu, Gerald C (2020) “Investigation of the triangular dual-correlations among weight, glucose, blood pressure using 6.5 years data using GH-Method: math-physical medicine (No. 299).”