Article / Short Communication
eclaireMD Foundation, USA
Gerald C. Hsu
eclaireMD Foundation, USA
6 August 2020 ; 22 August 2020
This research note describes the author’s investigation on differences among his three meals, which include breakfast, lunch, and dinner, in terms of their influential factors and their respective PPG data and waveforms. He further described the relationship between his body weight and meal quantity percentage for his normal portion. During this period, from 5/5/2018 to 7/14/2020, he collected detailed information of his 2,403 meals and ~64,000 glucose data.
The research results clearly indicate the following three pseudo-linear relationships exiting among several influential factors and related end results:
- His meal quantity percentage, carbs/sugar amount, and Finger PPG value.
- His carbs/sugar amount, and Finger PPG value since his exercise amount has been kept at an almost constant level.
- His meal quantity percentage as of his normal portion and his body weight, since his bowel movement amount has been kept at an almost constant level.
The investigation into his three meals revealed his heavy lunch, moderate breakfast, and light dinner possess a similar ratio and order of magnitude in terms of amounts of meal quantity percentage for his normal portion and his average carbs/sugar intake. As a result of these apparent ratios and similar patterns, his different measured PPG values appear in the same order of lunch having the highest, breakfast in the middle, and dinner at the bottom. These findings match with the common knowledge of “should be” from the general public. However, the author used a quantitative approach and offered a more accurate and higher precision of scientific proof.
This research note describes the author’s investigation on differences among his three meals, which include breakfast, lunch, and dinner, in terms of their influential factors and their respective postprandial plasma glucose (PPG) data and waveforms. He further described the relationship between his body weight and meal quantity percentage for his normal portion. During this period, from 5/5/2018 to 7/14/2020, he collected detailed information of his 2,403 meals and ~64,000 glucose data.
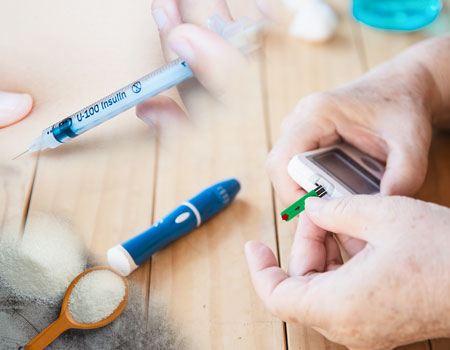
Starting from 5/5/2018, the author applied a continuous glucose monitoring (CGM Sensor) device on his arm to collect his daily glucoses at 15-minute intervals, collecting ~80 glucose data per day.
In the meal database, he collects his carbs/sugar amount in grams, post-meal walking steps, finger-piercing measured PPG, and sensor collected PPG. Each day, he enters his input data into his developed APP software, EclaireMD system, on the iPhone, including his estimated meal quantity percentage for his normal portion of the 100% baseline along with his bowel movement amount percentage (level 1 is 0% and level 5 is 100%). During 2015 and 2016, he developed four prediction models of weight, fasting plasma glucose (FPG), PPG, and HbA1C with a prediction accuracy of above 95%. In this study, he has two datasets of PPG values, one from finger-piercing measurements and the other from CGM Sensor measurements. His 3-hour sensor PPG waveform (i.e. curve) contains 13 glucose data points; therefore, he can easily identify how high his peak PPG value and at which time instant it occurs for each meal and synthesized PPG curves for breakfast, lunch, and dinner. His predicted PPG is based on his input values of carbs/sugar amount (39%), post-meal walking (41%), weather temperatures (5%), and other 16 secondary influential factors (15%).
His body weight prediction is based on his daily food intake quantity percentage for his normal portion of 100% and his daily bowel movement amount percentage of his normal amount.
Figure 1 shows the data table of the variables mentioned above and analysis results. Figures 2, 3, and 4 depict the data table graphically.
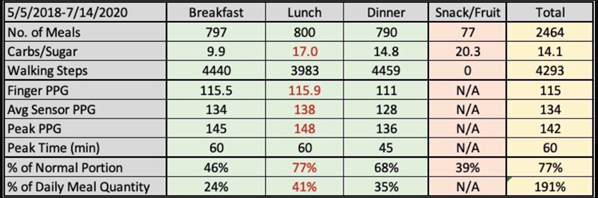
Figure 1: Data table
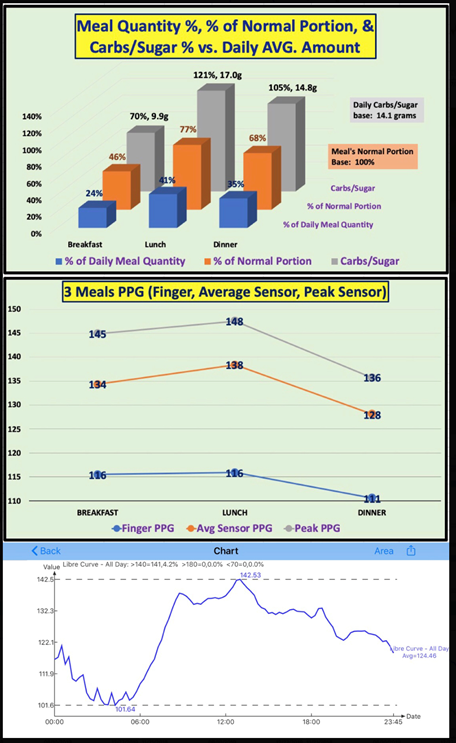
Figure 2: Three meals (breakfast, lunch, & dinner)
In Figure 2, the top diagram shows Lunch representing the highest values in terms of carbs/sugar amount, meal’s quantity percentage of his normal portion, and percentage of the daily total consumption of food and meal. It indicates that his carbohydrates and sugar intake amount is directly proportional to his meal quantity percentage of the normal portion. His breakfast is lighter than his lunch and his dinner is the lightest meal of the day due to his weight concerns. These findings are the same as the observation from the bottom diagram in Figure 2 which demonstrates his daily glucose fluctuations’ highest peak occurring around 60-minutes after the first bite of his lunch. The second peak happens one hour after his breakfast and the third peak occurs at one hour after his dinner. The glucoses of the rest of the day are lower than his three meal periods (3-hours for each period). The middle diagram in Figure 2 illustrates his PPG, including Finger, average sensor, and peak sensor values. It is noticeably clear to observe that a linear relationship exiting among his meal quantity percentage, carbs/sugar amount, and Finger PPG value.
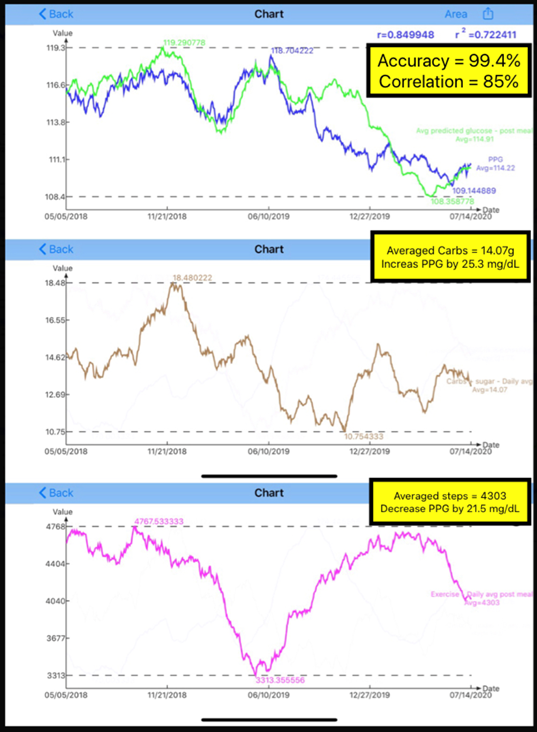
Figure 3 : PPG and carbs/sugar amount with post-meal walking
Figure 3 reflects both his measured and predicted Finger PPG and his carbs/sugar intake with post-meal walking steps. These two PPG curves have a correlation coefficient of 85% which is extremely high. By examining these two average PPG values, with measured PPG at 114 mg/dL and predicted PPG at 115 mg/dL, his prediction accuracy reaches 99.4%. In addition, his Finger PPG has dropped from 117 mg/dL in mid-2018 down to 108 mg/dL in mid-2020. This PPG reduction is mainly due to his reduction of carbs/sugar intake from 18.5 grams from end of 2018 to ~13.5 grams at mid-2020 (see middle diagram in Figure 3). In the bottom diagram of Figure 3, we see that his post-meal walking steps are regularly maintained at ~4,300 steps. By applying his developed “Linear prediction model” and his average carbs/sugar amount of 14.1 grams and average walking of 4,303 steps, he could easily calculate his predicted Linear PPG value as follows:
Predicted Linear PPG = Baseline PPG (110 mg/dL) + (carbs 14.1 grams * 1.8) – (4393/1000) * 5 = 110 + 25.3 – 21.5 = 113.8 mg/dL
It is clear to observe the pseudo-linear relationship exiting between his carbs/sugar amount, and Finger PPG value since his exercise amount has been kept at an almost constant level.
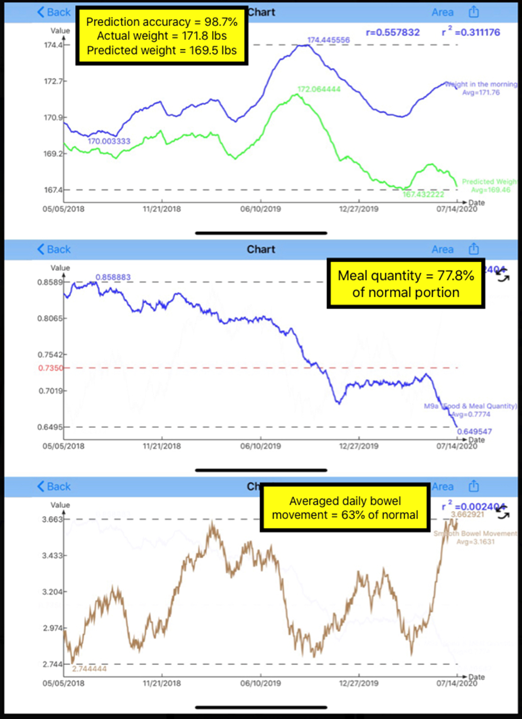
Figure 4: Weight and meal quantity % with bowel movement
Figure 4 indicates the relationship between his body weight and meal portion (i.e. food quantity percentage) plus bowel movement amount. In the top diagram of Figure 4, there are two weight curves: the measured daily body weight (171.8 lbs.) and daily predicted body weight (169.5 lbs.), which have a prediction accuracy of 98.7%. His weight prediction is based on his meal quantity percentage for his normal portion by using this as the baseline of 100%. The bowel movement is the secondary input for his weight prediction. From the bottom diagram in Figure 4, we see his bowel movement amount percentage has been maintained around 63% of his normal amount for the period of 2010 to 2017. The author is 73-years old and he started to decrease his food portion intake approximately in 2018 to further reduce his body weight. Therefore, his bowel movement amount has been reduced as well. From the middle diagram of Figure 4, his average meal quantity percentage is 77.8% and has been reduced from 86% in mid-2018 to 65% in mid-2020, which is a 20% reduction. As a result, his body weight has been reduced from ~174 lbs. in mid-2019 to ~171 lbs. in mid-2020. His average weight for the last two weeks is around 169.5 lbs. which cannot be shown in his 90-days moving average weight curve. Furthermore, it is also clear to observe a pseudo-linear relationship exiting between his meal quantity percentage of his normal portion and his body weight, since his bowel movement amount has been kept at an almost constant level.
The investigation into his three meals revealed his heavy lunch, moderate breakfast, and light dinner possess a similar ratio and order of magnitude in terms of amounts of meal quantity percentage for his normal portion and his average carbs/sugar intake. As a result of these apparent ratios and similar patterns, his different measured PPG values appear in the same order of lunch having the highest, breakfast in the middle, and dinner at the bottom. These findings match with the common knowledge of “should be” from the general public. However, the author used a quantitative approach and offered a more accurate and higher precision of scientific proof.
- Hsu Gerald C (2020) “Using GH-Method: math-physical medicine methodology and four clinical cases to study type 2 diabetes patients’ liver and pancreas baseline conditions (No. 103).”
- Hsu, Gerald C (2020) “A simplified yet accurate linear equation of PPG prediction model for T2D patients using GH-Method: math-physical medicine (No. 97).”
- Hsu, Gerald C (2020) “Using GH-Method: Math-Physical Medicine to Conduct Segmentation Analysis to Investigate the Impact of Different Intensity of Exercise on Postprandial Plasma Glucose (No. 70).”
- Hsu, Gerald C (2020) “Using GH-Method: Math-Physical Medicine to Conduct Segmentation Analysis to Investigate the Impact of Low-Carbs and High-Carbs Diets on Postprandial Plasma Glucose (No. 69).”
- Hsu, Gerald C (2020) “Summary of glucose behavior study using GH-Method: math-physical medicine methodology (No. 104).”