


Article / Review Article
Huffington Foundation Professor of Economics and Environmental Studies, Emeritus, Wesleyan University, Middletown, CT USA.
Gary Yohe,
Huffington Foundation Professor of Economics and Environmental Studies, Emeritus Wesleyan University, Middletown, CT USA.
11 February 2026 ; 17 February 2026 ; 27 February 2026
Citation: Yohe, G. W. (2026). Defending climate science in a hostile world. Adv Earth & Env Sci; 7(1):1-5. DOI : https://doi.org/10.47485/2766-2624.1086
Climate science and climate scientists are facing a hostile world where even government agencies can produce, distribute, and self-reference official documents that are littered with scientific “findings” that are, in fact, statements of misinformation and disinformation. Staying “within our knowledge sandboxes”, the science community must assume the additional responsibility of defending what is actually known, unknown, and why. Most directly, meeting this challenge is accomplished by showing why faulty findings are completely false, extremely suspect because they are the product of judicious cherry-picking, or just misleading in their emphasis of persistent uncertainties without reference to relevance to something that matters. In other instances, official documents can motivate an updated assessment that replaces cherry-picked samples with complete data sets and exhaustive traceable accounting to the underlying literature.
In this paper, I will make these points with reference to the US Environmental Protection Agency’s (USEPA) list of the 5 most likely causes of warming while dismissing anthropogenic emissions of greenhouse gases entirely (Environmental Protection Agency [EPA], 2026). In the first section, I will attempt to debunk each of the five reasons and add concise evidence that the planet is warming and that human influences are largely to blame. It contains examples of how to confront disinformation from official sources simply by referencing established science.
In the second section, I describe how Christopher Piecuch of the Woods Hole Oceanographic Institution responded to a false statement about sea level rise (SLR) in Department of Energy’s (USDOE) deceitful July report on the state of our understanding of the impacts of greenhouse gas emissions on the United States (DOE, 2025). He was motivated to publish some contradictory new science in AGU Advances.
Concluding remarks summarize the value of taking up one of these two ways to defend scientific integrity from dogmatic attacks designed to support the President’s view that “This ‘climate change,’ it’s the greatest con job ever perpetrated on the world, in my opinion (PBS, 2025).”
Defending climate science with a careful reading of the official USEPA website.
On December 3rd of 2025, the USEPA updated its website by replacing its previous posting on the Causes of Climate Change. Why? Because, in their words, “Natural processes are always influencing the earth’s climate and can explain changes prior to the Industrial Revolution in the 1700s. However, recent climate changes cannot be explained by natural causes alone.” To be clear, the first industrial revolution began around 1830, but its incidence was primarily confined to the United Kingdom. It was not until late in the 19th century that fossil fuels spawned the second transformation with global consequences (Britannica, 2026).
It is important to note before proceeding that only 1 of the 10 citations point to an assessment published after 2020. Four others point to an updated study published in 2020 jointly by the Royal Society and the US National Academy of Sciences (USNAS). Why is that important? Because the first sentence in that volume is “CLIMATE CHANGE IS ONE OF THE DEFINING ISSUES OF OUR TIME. It is now more certain than ever, based on many lines of evidence, that humans are changing Earth’s climate (National Academies of Sciences, Engineering, and Medicine [NASEM], 2020).” More on that, later.
Based on the just cited 2020 USNAS report, the USEPA writes “Changes in the earth’s orbit and its axis of rotation have had a big impact on climate in the past. For example, the amount of summer sunshine on the Northern Hemisphere, which is affected by changes in the planet’s orbit, appears to be the primary cause of past cycles of ice ages…,”
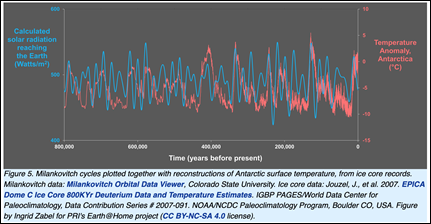 Figure 1: Solar radiation and Temperature Anomaly in Antarctica. Source: Figure 5 in https://earthathome.org/quick-faqs/are-orbital-changes-causing-global-warming/
The Agency is referencing the Milankovitch cycles that are displayed here as Figure 1. It shows maybe 35 cycles over the past 800,000 years. Put another way, Milankovitch cycles lead to climate changes on the order of a few degrees over thousands of years.
For the 75 years of the period when we have seen accelerating warming from 1950 through 2025, temperature changes from the latest Milankovitch cycle would have therefore produced an insignificant cooling in Antarctica rather than the fairly significant warming observed actually observed. The same can be said for time scales from the second or even the first industrial revolution (IERE, 2025).
In this case, the USEPA mentions a second cause that it cannot be supported by the data. The Agency notes that changes in the sun’s energy output can affect the intensity of the sunlight that reaches the earth’s surface, but then report that satellite measurements of the energy received by the earth from the sun since 1978 have been relatively stable while global surface temperatures have risen significantly. In fact, as displayed in Figure 2, variability in solar activity tracked temperatures pretty well from 1880 through 1960. After that through the present, temperatures have increased more rapidly than before while solar activity declined.
The USEPA recognizes that this cause relies on the well accepted finding that the “amount of sunlight that is absorbed or reflected by the planet depends on the earth’s surface and atmosphere.” This is because dark objects and surfaces absorb sunlight while light-colored objects and surfaces reflect it. This is a positive feedback that accelerates the pace of warming as the darkening of the earth’s surface (e.g., by melting of the Arctic sea ice as well as land-based glaciers) allows the earth to absorb more of the energy and adds to the warming; but it is not a driving force behind the warming (MSN, 2025).
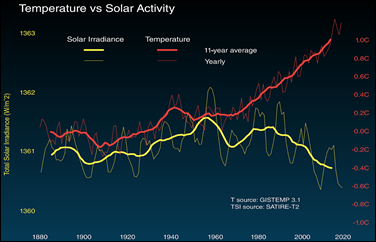 Figure 2: Temperature versus solar. Source: https://science.nasa.gov/earth/climate-change/what-is-the-suns-role-in-climate-change/
Volcanoes have affected the climate from time to time, but they do not produce warming. Their effects of global temperatures are driven by particles that reflect sunlight back into space, but they do not remain in the atmosphere for more than a year or two. Moreover, issues of scale must be considered. In terms of warming potential equivalence, eruptions the size of Mount St. Helens would have to occur every 2.5 hours of every day to match the effects of human induced greenhouse gas emissions (NASA, 2026).
The discussion of this potential cause summarizes the paleo record depicted in Figure 3 where results from ice core data show that warmer periods coincide with relatively high carbon dioxide concentrations. Carbon dioxide levels have been higher during warm interglacial periods and lower during the intervening glacial periods. It is proposed here that “These changing concentrations have acted as another positive climate feedback amplifying the temperature changes caused by long-term shifts in the earth’s orbit.”
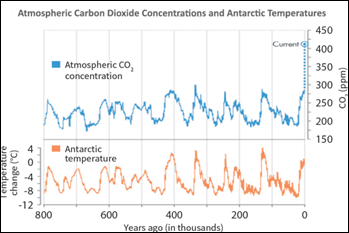 Figure 3: Temperature versus atmospheric concentrations of carbon dioxide. Source: https://royalsociety.org/-/media/policy/projects/climate-evidence-causes/climate-change-evidence-causes.pdf
Correlation does not mean causality, of course. At the very least, time scales and rates of change must be considered. In this figure, the last 75 years are buried in the vertical dotted line on the right-hand side of the concentration time series. They show levels that have not been seen over the past 800,000 years, so this naturally occurring variation in concentrations really says nothing about the second industrialized era with its increasing consumption or fossil fuel.
So, what is the takeaway from this new posting by the USEPA? The second sentence of their revision reads “However, recent climate changes cannot be explained by natural causes alone.” OK. So the USEPA recognizes the need for another explanation, but they stop short of suggesting the obvious one – anthropogenic emissions of greenhouse gases. The available evidence makes it clear that that omission is inexcusable.
We know that human emissions CAN explain the last 75 years of warming, and Figure 4 shows how. Notice first that the black jagged line tracking actual annual temperature estimates from the start of the second industrial revolution through 2022 always lies within the orange region – an uncertainty “cone” created by model runs from more than 30 different variants that included observed forcing from actual observed emissions from actual human activity. Notice that those temperature runs begin to rise significantly above the turquoise region around the end of the last century. The turquoise region captures results from model runs (by the same model ensemble) that include all of the possible causes of temperature as those that produced the orange region except that they exclude forcing by human-induced emissions. Around the year 2000, the orange and turquoise regions separate completely. It becomes statistically impossible for actual temperatures for any year after the year 2010 or so to have been drawn at random from the distributions captured in turquoise region.
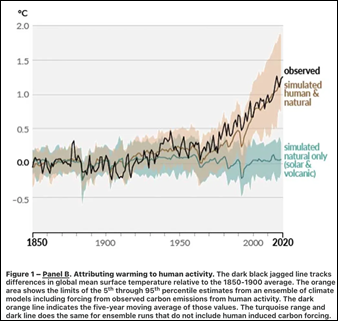 Figure 4: Attributing warming to human activities. Source: https://climatecafe.substack.com/p/the-climate-is-changing-show-me-the-203 and https://worldfinancialreview.com/a-nobel-prize-in-physics-that-we-can-all-understand/.
Most of the discussions of Figure 4 speak to the upper orange distribution that include CO2 forcing from human activity. The lower turquoise distribution does not include that forcing, but it includes everything else in the EPA’s list of causes. Note that the median line through the turquoise distribution shows no trend. And so, the EPA’s ignoring human emissions of greenhouse gases when it cast its new list of causes of the warming cannot replicate the recent past.
Defending climate science with new science that rebuts a false official claim.
On July 23rd of last year, the USDOE posted “A Critical Review of Impacts of Greenhouse Gas Emissions on the U.S. Climate”. It was the six-week product of the Department’s Climate Working Group that had been created in early April. It was supposed to be a draft that would ultimately be amended in response to comments submitted during its public review period. More than 600,000 separate comments were formally submitted to the Department. They included two particularly critical assessments of the current science by the National Academies of Science, Engineering and Medicine and a team of international scientists coordinated by atmospheric scientist Andrew Dessler of Texas A&M University. The draft has been made official so that it could support rescinding the 2009 Endangerment Finding, but not a single word or piece of punctuation has been changed.
The two large assessments found much to criticize in the report, but claims that “U.S. tide-gauge measurements in aggregate show no obvious acceleration in sea-level rise beyond the historical average rate” caught the eye of Christopher Piecuch of the Woods Hole Oceanographic Institution. He noted that this proposed finding was based on tidal gauge data from five locations chosen from the more than 80 locations in the continental United States for which long time series data exist. Figure 5a, extracted from the USDOE report, shows their geographic coverage.
Table 1 replicates Table 7.1 from the same document; it “shows absolute sea level rise for selected locations, determined from the sum of uncorrected relative sea level rise (RSLR) as estimated from tide gauge time series (NOAA, 2022) and the vertical land motion (VLM) measurements” from sources published in 2012, 2015, and 2016. These locations happen to be places where VLM is particularly large, and so Piecuch (2025) set out to conduct a careful statistical analysis of the entire sample.
In terms of a national average, he found that rates of coastal sea-level rise have doubled over the past 125 years and that current rates are running well above the historical average. Put another way, he has produced some new science that contradicts the USDOE report. Figure 5b shows his statistical results; they show rigorously that coastal sea level rise around the contiguous 48 states has been accelerating.
Sections 1 and 2 illustrate two ways that the scientific community can defend the scientific integrity of its established understandings from dogmatic attacks designed deliberately to undermine public confidence in that body of knowledge. The first method draws directly from that knowledge by addressing contrarian statements one at a time. The other creates new science by applying the skeptical tools of the scientific method to a suspect claim authored using questionable methods by well-known climate deniers. The examples are not meant to be convincing on a macro scale, but they do show what is possible if motivated scientists accept their responsibilities to apply their honest skepticism not only to new hypotheses on the frontiers of our understandings but also to new restatements of debunked propositions.
Table 1: Selected sites used in the USDOE climate report to claim that there has been no acceleration in the rate of SLR relative to the historical average due to climate change. Source: Table 7.1 on page 76 of https://www.energy.gov/sites/default/files/2025-07/DOE_Critical_Review_of_Impacts_of_GHG_Emissions_on_the_US_Climate_July_2025.pdf
| Location | RSLR | VLM | ASLR |
|---|---|---|---|
| San Francisco, CA | +0.08 | -0.06 | +0.02 |
| Galveston, TX | +0.26 | -0.19 | +0.07 |
| Grand Isle, LA | +0.36 | -0.28 | +0.08 |
| St Petersburg, FL | +0.12 | -0.02 | +0.10 |
| New York City, NY | +0.11 | -0.05 | +0.06 |
Table 7.1 Absolute sea level rise (inches/year) consisting of Relative Sea Level Rise (RSLR) plus Vertical Land Motion (VLM)
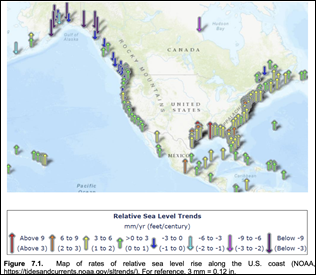 Figure 5a: Locations of tidal gauges that support long time series of SLR. Source: Figure 7.1 on page 76 of https://www.energy.gov/sites/default/files/2025-07/DOE_Critical_Review_of_Impacts_of_GHG_Emissions_on_the_US_Climate_July_2025.pdf
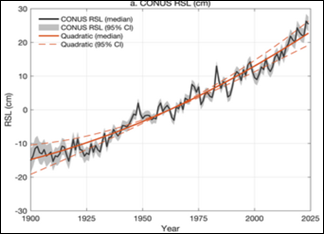 Figure 5b: RSL changes for the contiguous 48 states. Time series drawnfrom the Bayesian data analysis (black line is median; gray shading is 95% credible interval) and the quadratic fit (orange line is median; orange dashes are 95% credible intervals). Source: https://agupubs.onlinelibrary.wiley.com/doi/full/10.1029/2025AV002018
The second Trump administration is not the only source of attempts to undercut public confidence in climate science. The current government is a major source of concern; it is not alone, but it is continuing. On February 10th, Timmer (2026) reported that Republican state Attorneys General expressed concern that the latest Federal Judicial Center (FJC 2025) sponsored Reference Manual on Scientific Evidence “treated human influence on climate as fact”. That is exactly what NASEM (2025) and even the NASEM (2020) report that USEPA so often cites concluded. Human influence on the climate system is fact. Nonetheless, the chapter on climate science is no longer available anywhere in the 1600+ page manual.
In summary, the attacks on climate science and climate scientists started shortly after the Second Assessment report of the IPCC stated in 1995 that “the balance of evidence suggests a discernible human influence on global climate” (Santer, 2026). The attacks have not only expanded in scope, intensity, and frequency since then. They have been accompanied by damaging action over the past 13 months.
This acceleration in action since the last election is not a surprise, of course. According a recent posting in Climate Forward (New York Times [NYT], 2026), it is the product of detailed plans conceived by Trump loyalists over the four years that they have worked outside of their White House posts over the four years between the 2020 election and Inauguration Day in January of 2025.
The attacks and the actions will not stop any time soon, but the foundations of robust defense have been laid. The evidence that they are dishonest and damaging is now demonstrability stronger than ever before. And it has never been more important for the scientific community to defend its work with passion and integrity.
- Environmental Protection Agency (EPA). (2026). “Causes of climate change”, https://www.epa.gov/climatechange-science/causes-climate-change last accessed on February 10, 2026
- DOE, (2025). “Critical review of impacts of GHG emissions on the US Climate”, https://www.energy.gov/sites/default/files/2025-07/DOE_Critical_Review_of_Impacts_of_GHG_Emissions_on_the_US_Climate_July_2025.pdf last accessed on February 10, 2026
- PBS. (2025, Sep 25).“Trump called climate change a con job at the United Nations – Here are the facts and context”, https://www.pbs.org/newshour/politics/trump-called-climate-change-a-con-job-at-the-united-nations-here-are-the-facts-and-context
- Britannica, (2026).“Industrial revolution”, https://www.britannica.com/event/Industrial-Revolution
- National Academies of Sciences, Engineering, and Medicine (NASEM). (2020). and the Royal Society, 2020 Climate Change: Evidence and Causes: Update 2020, Washington, DC: The National Academies Press. https://royalsociety.org/-/media/policy/projects/climate-evidence-causes/climate-change-evidence-causes.pdf
- IERE. (2025, May 28). “Milankovitch cycles explain climate change?”, https://iere.org/do-milankovitch-cycles-explain-climate-change/
- MSN. (2025). “New NASA data shows earths overall reflectivity is dimming”, https://www.msn.com/en-us/weather/topstories/new-nasa-data-shows-earth-s-overall-reflectivity-is-dimming/ar-AA1S1FNF
- Piecuch, C. (2025). “The rate of U.S. coastal sea-level rise doubled in the past century”, AGU Advances, https://agupubs.onlinelibrary.wiley.com/doi/full/10.1029/2025AV002018
- Timmer, J. (2026, Feb 10). “After Republican complaints, judicial body pulls climate advice” https://arstechnica.com/science/2026/02/us-court-agency-pulls-climate-change-from-science-advisory-document/
- Federal Judicial Center (FJC), (2025). of the National Academies of Science, Engineering, and Medicine (NASEM), Reference Manual on Scientific Evidence, Fourth Editions, https://www.fjc.gov/sites/default/files/materials/15/Reference%20Manual_02052026.pdf
- Santer, B. (2025). “A climate scientist reflects on 30 years fighting the ‘forces of unreason’”, Bulletin of the Atomic Scientist, https://thebulletin.org/2025/11/a-climate-scientist-reflects-on-30-years-fighting-the-forces-of-unreason/
- New York Times (NYT). (2026, February 10). “The conservative activists behind the scenes”, Climate Forward, https://messaging-custom-newsletters.nytimes.com/dynamic/render?isViewInBrowser=true&productCode=CLIM&sendId=215074&uri=nyt%3A%2F%2Fnewsletter%2F89700cad-d2c2-5b25-8f20-b2e68ffad0da