


Article / Research Article
Faculty of Economics and Business, Universitat Oberta de Catalunya (UOC), Rambla del Poblenou, 156, 08018 Barcelona, Spain
Rubén Rodríguez Elizalde,
Faculty of Economics and Business,
Universitat Oberta de Catalunya (UOC),
Rambla del Poblenou, 156,
08018 Barcelona,
Spain.
20 November 2022 ; 6 December 2022
Heritage monuments and ancient constructions are complex and delicate. Its conservation is vital for its subsistence and durability; its conservation is a challenge from a technical point of view. An early and adequate diagnosis of any pathological lesion in a monument is key to its maintenance and preservation. For this, auscultation techniques are necessary that allow a quick and effective diagnosis, but above all that is not harmful to its constituent materials. With this premise, from the author’s experience, this article exposes the most accessible and recommended immediate and instrumental techniques to be used directly on a monument. With them, an adequate pathological diagnosis of the monument can be made, locating possible lesions before they manifest or develop too much, and their removal becomes complicated.
Keywords: Drones, Heritage, Inspection, Heritage preservation, Pathological diagnosis monuments.
Old and heritage buildings are special and delicate. Conserving, maintaining, and repairing them is an engineering challenge and an architectural challenge. A good diagnosis is the best guarantee to apply the correct treatment. This good diagnosis is largely based on the experience of an appropriate specialist. This specialist can, in turn, and in any way, be helped by different techniques to deepen the knowledge of the degradation processes that are punishing the monument.
There are many techniques for the inspection and auscultation of monuments and ancient constructions. Among these techniques, some are immediate and others require complex instrumentation. This complex instrumentation does not imply that it cannot be used in situ, in the monument itself. Finally, there are those auscultation techniques that require the collection of samples and data, for their elaboration in the laboratory and office. This article focuses on the techniques that provide data immediately, analyzing their scope and the useful information they can obtain.
When we talk about immediate techniques, we are talking about organoleptic techniques (obtained directly) or we are talking about techniques that can be performed with very simple instruments.
No instrumental technique can substitute for careful observation. Inspection by an experienced eye is key in any reconnaissance process. The examination of the materials that make up the monument (stone, brick, mortar,…). It is convenient to help us with a knife and a magnifying glass (or a pocket microscope). Later, we will observe the injuries and the processes that can affect the materials and the causes of these injuries (García de Miguel, 2009).
Inspection is essential for recognition. Structural inspection is an essential operation for the conservation of any construction (Rojo, 2020). This was initially applied (and in a very specific way) to the structural field. This is independent of the constituent material of the structure (Hugenschmidt & Mastrangelo, 2006; Sandberg et al. 2022). Inspection is also essential in any heritage construction for its preventive conservation (Tortajada Hernando, 2011).
The inspection essentially consists of the characterization and monitoring of the construction, as well as each of the different elements that make it up (Bianchi & Hebdon, 2022). This may be accompanied by tests, depending on the type and scope of inspection undertaken. Some of these essays will be analyzed here. All these tests must allow for complementing the diagnosis made by visual inspection.
In recent years, drones have been incorporated to carry out this type of inspection (Elizalde, 2022). Several experimental inspections carried out on constructions have shown that the use of a suitable drone (Fig. 1, Fig. 2 y Fig. 3) allows a detailed and complete visual observation (Fig. 4) of all the visible elements of the monument, accessible and non-accessible (Elizalde, 2022). The concept of accessibility is important because it is where the drone becomes most important: conceptually, the inspection must include all visible elements, whether they are accessible or inaccessible. Therefore, the maximum difficulty comes when an inaccessible element is visible: the drone usually reaches this point without any problem. Indeed, the drone does not meet the definition of immediate techniques at the beginning of this section: the drone is not an organoleptic technique or a simple instrument. However, its purpose is visual.
The incorporation of the drone is very interesting: without this small multi-rotor aircraft, we would need extraordinary means of access to inspect many heritage elements. The drone simplifies planning work since it reduces the planning and acquisition of auxiliary means of access.
The drone simplifies fieldwork, to identify and assess the deterioration of each of the constituent elements of the monument. This simplification, together with the previous one, allows you to carry out the work more quickly.
In addition, the drone reduces risks in a double dimension:
- It reduces a considerable part of the risks of damage to the monument;
- It reduces all kinds of risks to the safety of the workers who should collaborate in the inspections, given the danger inherent in the use of certain auxiliary means to access certain elements of the structure: with a drone, no worker has to, for example, expose yourself to the risk of falling from a height.
All of the above implies considerable economic savings, which does not imply a decrease in the quality of work. With the data collected with the drone (Fig. 4), a complete technical report of the inspection carried out can be generated in the cabinet, in addition to supplying the pertinent information for its incorporation into a management system and obtaining the status indices of each of the elements and the construction as a whole, to assess whether any type of urgent action is required or to verify, through a regular check of the injuries detected through periodic flights, the evolution of said injuries.
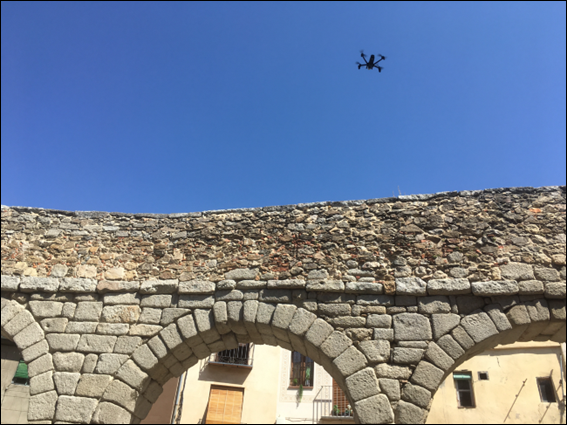
Figure 1: Quadrotor drone flying over the Roman Aqueduct of Segovia, for inspection (photo by the author).
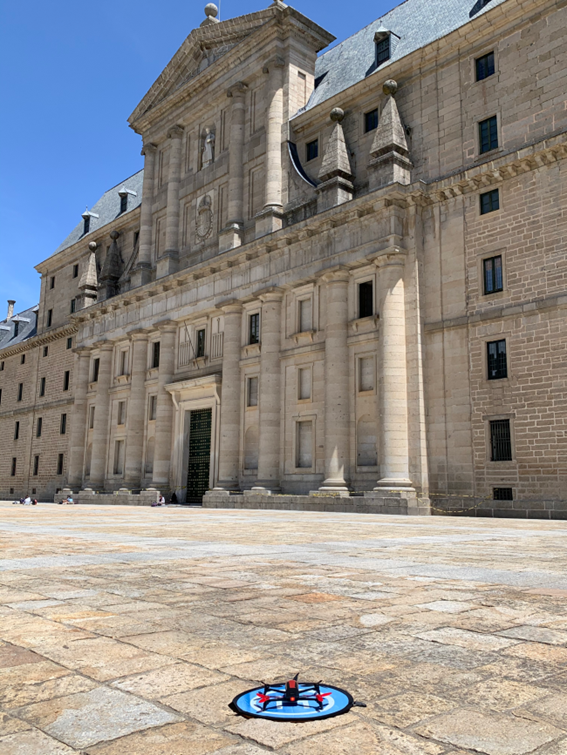
Figure 2: Quadrotor drone ready to take off, for an inspection on the main facade of the Monastery of El Escorial, Spain (photo by the author).
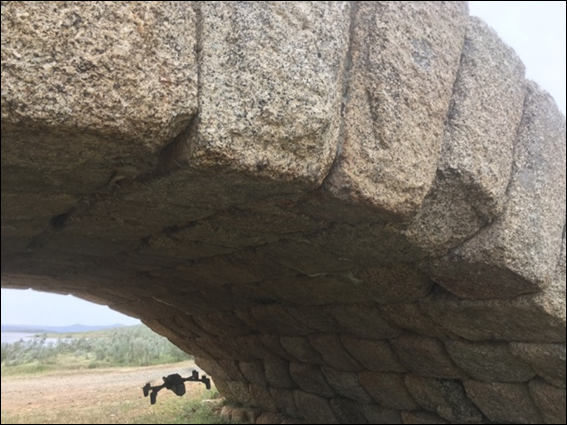
Figure 3: Quadcopter drone circulating inside the first vault of the Roman Bridge of Alconetar (Spain), for inspection of its intrados (photo by the author).
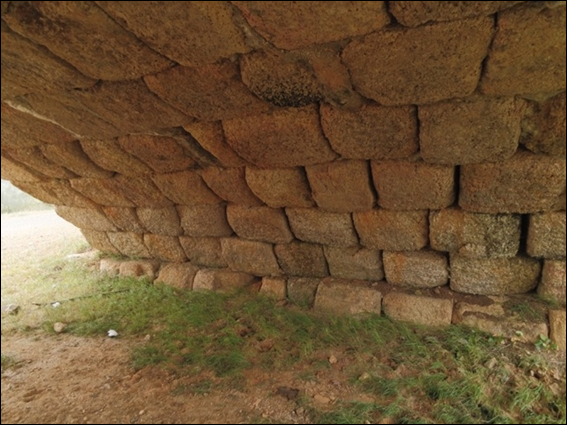
Figure 4: Image taken by the drone during its transit through the interior of the vault, captured in Fig. 3 (photo by the author).
If possible, it is preferable to observe the stone in fresh fracture. Thus, we can appreciate its mineralogy and texture, without natural patinas and/or without applied patinas (Kröner et al., 2010). Altered stone can vary greatly in tone and colour from the fresh stone. Basic rocks (such as basalts or black granites) are very dark in colour when broken or polished and may appear ochre in outcrops in the field. Surface styling can affect tone and colour. The same type of rock can have different colors. Although the normal shades (for example, of limestone and marble) are clear, black limestone exists.
The granites, generally light gray tones, can appear pink and red. Granites are well recognized by the equidimensional granular texture (Fig. 5). The grain size can vary from a millimeter to more than a centimeter. However, the size of normal grains is 2 or 3 millimeters. Its minerals cannot be scratched with a knife.
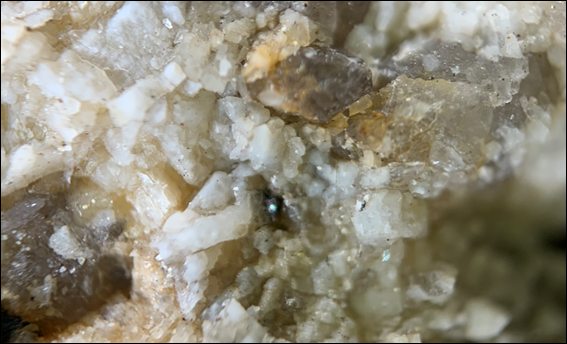
Figure 5: The texture of the granite of an ashlar from the Monastery of El Escorial (Spain), seen with a 50X magnifying glass (photo by the author).
Granite is the sum of quartz, mica, and feldspar. Thus, calcosodic feldspar is always white and potassium feldspar can also be white or cream-colored (Fig. 5); however, the potassium feldspar in some granites is pink or red. In any case, all feldspars have a stone-like sheen.
Morphologically, mica is laminar and shiny. It can be white or black. (in Fig. 5 it is black). Its strong basal transept is characteristic. Sometimes several small sheets are grouped into one unit. Black mica may have a certain bronze sheen (Fig. 5).
For its part, the quartz of the granite appears as grayish grains.
Granite can have different particular textures. For example, it can present large white feldspar crystals, like “horse’s teeth”. In some varieties these crystals are sporadic, but in other varieties, they are very abundant. Sometimes they show up oriented. Black micas can also form dark aggregates.
Other discontinuities in the granite present rounded dark spots called barges (García de Miguel, 2009). Sometimes we can see fragments of other rocks included in its mass, known as enclaves (García Moreno & Corretgé Castañón, 2000); or we can find bands of dark minerals, known as schlieren (Wiebe et al., 2007). When the grains on its surface are altered, they come off with the touch of the hand (Alemany, 2007). Coarse sand appears in the vicinity, made of quartz and feldspar grains of irregular shapes and sizes (archoic sands).
The limestones and dolomites are identical. Both are easily scratched by a razor (Fig. 7). Their colors and textures can vary widely. With a drop of hydrochloric acid, limestone produces strong effervescence, while dolomite is not affected. This serves as a diagnosis to distinguish them (Liu et al., 2005).
Normally the grain size cannot be distinguished with the naked eye. Sometimes they have fossils. Fissures filled with white spatik calcite are frequent. Serous cavities may also appear, with or without a lining of calcite crystals. If the crystals are dolomite, they can have rhombohedral shapes. In both cases, the crystals are also easily scratched by the razor. There are very ocherous travertine varieties, others are compact; there are also granular ones that resemble sandstone; oolitic formed by small spheres of concentric texture, etc.
Sandstones are characterized by a touch like the scraper of a matchbox. After all, they have cemented sands. Their colors can vary widely, but ocher tones predominate, from red to yellow. They may show cross-stratification. Calcarenites can only be distinguished from sandstones with the help of a microscope. Sandstones with calcareous cement produce effervescence with hydrochloric acid (Bell, 1992).
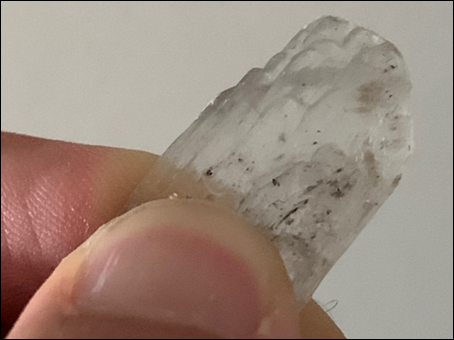
Figure 6: Crystallized gypsum, which can be scratched with a fingernail (photo by the author).
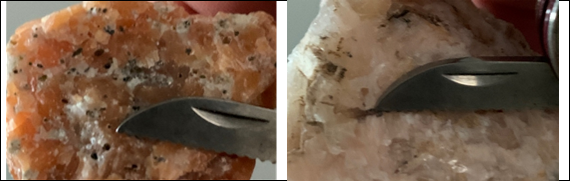
Figure 7: Limestone (left) and dolomite (right) are sedimentary rocks that can be scratched with a knife: to differentiate the two, we often need to resort to the use of acids (photo by the author).
Lime mortars are usually porous and white in colour, although in some cases baked earth or ground ceramics have been added to them, giving them ocher tones. Pieces of charcoal usually appear in its core, remains of the calcination process (Papayianni, 2006; García de Miguel, 2009). They can also present white powdery lumps of poorly calcined lime that have not reacted with the water. It is common to find ceramic pieces (tile or brick). Applying hydrochloric acid produces effervescence. (Elsen, 2012).
To estimate whether a mortar is fully carbonated, a drop of alcoholic phenolphthalein solution can be added (Chinchón et al., 2016). The strong alkalinity of uncarbonated lime will cause the originally colourless liquid to turn bright red. A pool pH test kit can also be used; in this case, we must extract a bit of mortar and pour it into water. This water will give us an elevated pH. Litmus paper can also be used to measure the pH (García de Miguel, 2009; Elsen, 2012).
If a mortar contains gypsum, it can be detected by dissolving some in acid, eg hydrochloric acid, and adding a drop of aqueous barium chloride solution. A white, insoluble barium sulfate precipitate will be produced, or if the amount is very small, the suspension of barium sulfate crystallites will cloud the solution.
The aggregate, sometimes, can also be identified with the naked eye (Figueiredo et al., 2008). Very rounded grains indicate river sand or gravel; whitish shellfish fragments indicate beach sand.
In the brick you can examine the degreasers used in its manufacture (usually quartz and feldspar sand and crushed ceramics). The appearance of the firing layer, if it is thick, well vitrified, its colour, indicative of the firing temperature, forms dimensions and marks on the surface. A characteristic belling sound indicates good doneness. It is also noted if there are shrinkage cracks during firing and drying; if all the bricks appear in homogeneous shades; whether characteristic blisters have occurred due to firecrackers or explosions during cooking; if the edges show scarification due to a paste that is too dry or too little fat before it is cooked; yes the alteration affects joints between pieces or the pieces, etc. (Lourenço et al., 2013).
If the stone contains an important clay fraction, it will stick to it when touched with the tongue. If you breathe on the material, it gives off a musty smell. This provides a first indication of whether a soil, limestone or sandstone, contains clay.
Marble is scratched with a knife, like a limestone; but unlike limestone, it never has fossils and other sedimentary structures, and usually has an equigranular texture, sometimes saccharoidal in fresh fracture. Dolomitic marble does not produce effervescence with acids, unlike calcitic marble (Camuffo, 1986; Franzini, 1995).
We can see injuries in the following singular elements in old buildings:
- Sockets. If there is sandblasting, loss of matter, efflorescence, joint loss, rounding of pieces, damp stains and other signs that could be indicating ascending capillarity (García de Miguel, 2017). Sometimes small injuries are caused by splashing from the droplets, so this alternative to capillarity should be considered as the cause of the damage (Figueiredo et al., 2008; Tortajada Hernando, 2011).
- Walls. Vertical runoff lines marked by sandblasting, loss of joints, presence of bio colonies, dirt stains alternating with washed areas. Examine the origin of the runoff line; they are usually losses or missing in cornices and projections, as well as washing of joints. Injuries can also occur from dripping from eaves or overhangs. In these cases, the trace of the lesions is horizontal (García de Miguel, 2009). Broken hidden downspouts produce characteristic vertical lesions and stains.
- Cornices, eaves and projections. The upper areas are usually washed, with loss of relief due to dissolution or weathering. Sheltered areas can present bio colonies, black crust (in urban environments), attacks by salts, accumulation of dust and dirt (García de Miguel, 2009; Katona, 2020).
Regarding the state of the surface, there are different proposals for a common nomenclature to designate the lesions that affect the stone. All these proposals have been compiled, refined and systematized by the International Scientific Committee for Stone (ISCS) belonging to the International Council on Monuments and Sites (ICOMOS), which has prepared an illustrated glossary of terms (ICOMOS-ISCS, 2018).
Many times it is interesting to carry out the mapping of injuries and, in parallel, the mapping of processes (García de Miguel, 2009). The difference is evident: the lesions are immediate and do not admit of interpretation. With this we try to reflect the existing damage, regardless of its cause. The processes require an interpretation. For example, if a plinth affected by capillarity appears, we will see damage to the materials. The cartography of injuries will reflect these damages without clarifying their origin (Fig. 8). However, process mapping will represent the cause, regardless of the nature of the damage.
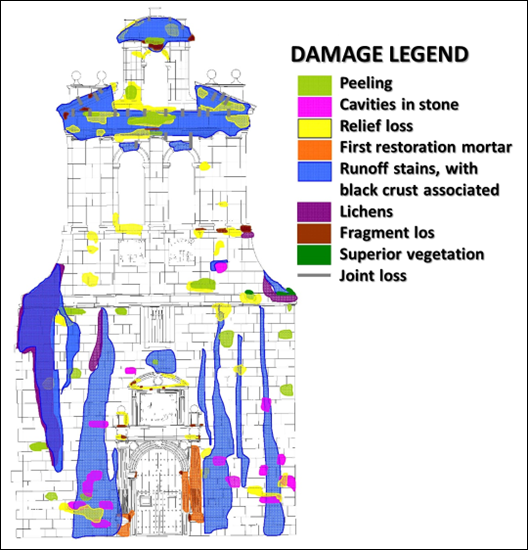
Figure 8: Lesions mapping on the main facade of the Chapel of San Ildefonso, in Alcalá de Henares, Spain (Elizalde, 2012).
In the auscultation of monuments, instrumental techniques try to reach where organoleptic techniques do not. For example, our eye is unable to see the interior of non-transparent objects; however, suitable sensors allow us to determine many of the internal characteristics of materials, which are characteristics not accessible to direct observation. To explain this, we can use a medical simile: a doctor is unable to see through his eyes into a patient’s body; however, an X-ray photographic plate becomes visible to him some parts of the body.
Most of the techniques we use are based on the emission of a signal. This signal is modified by the object that we need to investigate and later received by a sensor, once modified. The modification produced by the object allows us to know something about its nature and characteristics (San Andrés Moya & Viña Ferrer, 2004; Kröner et al., 2010).
To date, all possible signals have been experimented with, with success (Camuffo, 1986; Franzini, 1995; Figuereido et al., 2008; García de Miguel, 2009; Kröner et al., 2010; Lourenço et al. 2013; Zhao et al., 2019). We can say that the results are limited currently since they are quite expensive techniques in general, whose response is often uncertain or very difficult to interpret. However, as the methods and instrumentation are perfected, they may be much more useful and reliable in the future.
In the following sections, we present some of these techniques, although not all.
The sclerometer estimates the rebound that the tested material produces in a piston applied with constant energy given by the construction of the instrument. It essentially consists of a plunger, a spring of a certain stiffness, and a piston. The plunger is pressed into the hammer by pushing against the rock surface. The energy is stored in the spring which automatically releases it at a certain level of pressure, impacting the piston against the plunger. The rebound height of the piston is read on a scale (Aydin & Basu, 2005; Aydin, 2008).
There is a relationship between the rebound of the piston and the compressive strength of the material. This relationship is provided by the manufacturer of the Schmidt hammer by means of graphs and tables, and has been obtained by comparison with very careful and repeated normalized compression failure tests of cubic and cylindrical specimens that had previously been tested with the Schmidt hammer.
If the material is very resistant, the energy received by the impact is returned elastically. If the material is not very resistant, part of the energy received is absorbed in the form of small breaks and deformations (Kong et al., 2021). The presence of cracks close to the impact zone can affect the measurements (Williams & Robinson, 1983; Vandaele & Waelken, 1993). These measurements must be made perpendicular to the surface. The inclination strongly affects the measurements.
If it is a question of determining the compressive strength of sound material, a minimum of twenty (20) measurements are required. The ten (10) that provide lower values are discarded and the average of the ten with higher values is obtained. We assume that the lower ten responds to execution errors, such as the lack of perpendicularity between the hammer and the wall or surface irregularities that disperse the energy of the impact, to name a few.
Another utility of this technique is to determine the degree of alteration of the material (Vandaele & Waelken, 1993; San Andrés Moya & Viña Ferrer, 2004; Kröner et al., 2010).
If the value provided by healthy material is estimated, lower values would indicate degradation. However, we must take into account the natural heterogeneity of the stone that can provide a dispersion of values within an interval, for samples from the same quarry, without being altered.
It is a non-destructive method, so the instrument cost is very useful in heritage where, due to the historical-artistic value of the material, it is often not possible to extract specimens to carry out laboratory tests (Fig. 9).
The Schmidt hammer only informs about the superficial characteristics of the material (Buyuksagis & Goktan, 2007), up to where the influence of the impact reaches. This is not usually, however, a drawback: it is precisely the state of the surface and the most important data in terms of conservation. If the information on deeper areas is desired, it is necessary to use more penetrating signals such as ultrasound or, directly, extract cores and carry out tests on them (Kong et al., 2021). The equipment is portable and can be used both in the laboratory and in the field. There are models of the Schmidt hammer for different levels of impact energy. However, the hammer that we use must be suitable for the type of material to be tested. Thus, the impact of the Schmidt hammer will not damage the material, nor will it be so weak that measurements are unreliable (Aydin & Basu, 2005; Aydin, 2008).
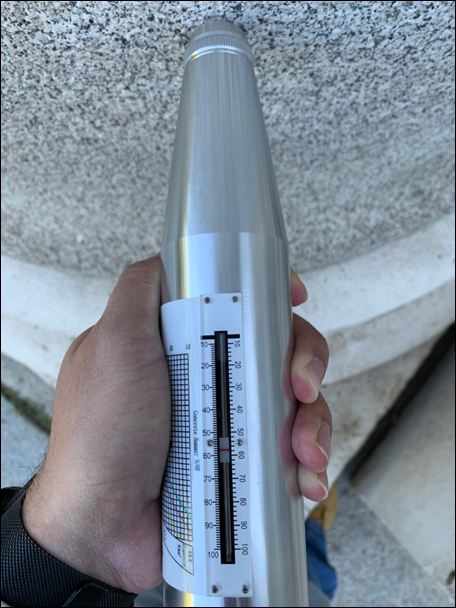
Figure 9: Measurement of the mechanical resistance by means of the Schmidt hammer, in a column at the entrance of the Prado Museum in Madrid, Spain (photo by the author).
The arrangement and nature of the lesions are sometimes correlated with the microclimate. The most indicative data are temperature and relative humidity (Bionda, 2004; Camuffo, 2019).
With them, for example, it is possible to establish the dew point and the possibility of condensation that could explain, in turn, the presence of damp spots and salts. The frequency of precipitation and its distribution, as well as the direction and intensity of the prevailing winds are also very significant data. Depending on the case, it may be interesting to know the number of frosts, condensation or dew, ultraviolet radiation, etc. (Kröner et al., 2010).
Orientation can also play a role in the typology of injuries (Camuffo, 1986; García de Miguel, 2009). Here the Porta de San Pedro ou Toledana of the Roman Wall of Lugo has been given as an example. Undrone during an inspection, a drone (Fig. 10, left) showed that in its east orientation (outer side of the wall), it received contamination from outside. Because of this, black scabs appeared. Loss of relief and sandstone, in synergy with biological growth (Fig. 10, right). Vehicles cannot circulate inside the wall (only in exceptional cases) for years. For this reason, the granite appeared clean on the west face (interior side of the wall).
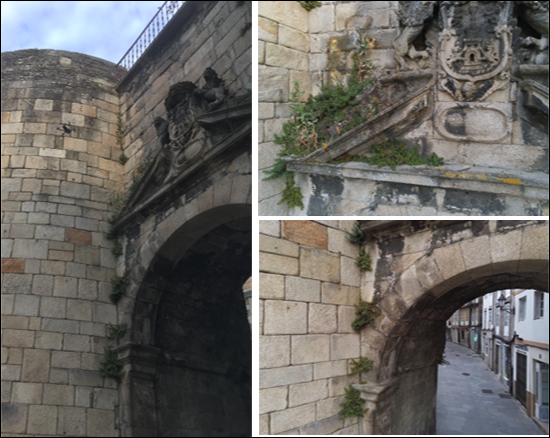
Figure 10: Flight of a quadcopter drone during the inspection of a singular point of the Roman Wall of Lugo; specifically in the Porta de San Pedro ou Toledana (left) and images captured by the drone (right), where the deterioration of the stone material can be observed (photographs by the author).
The climatic historical record can be obtained from the nearest weather station. However, many times we are interested in knowing the microclimate in the monument or even in parts or orientations of it (Guerra et al., 2019).
For rapid data collection, there are pocket instruments that allow us to estimate the prevailing conditions at a given time. However, we often need to know the evolution of the parameters over a long period of time (Austigard & Mattsson 2019). For this, a good solution is the microclimatic stations, which are placed in the appropriate locations according to the information that we intend to obtain.
Data loggers store the information in an electronic memory that they upload to a computer during a visit, but more sophisticated devices allow continuous monitoring by sending it to a central station that transmits it, via the Internet, to any point where the data center is located. Data reception and analysis (Essien et al., 2021). These devices not only transmit climatic information, but also any type of data that can be digitized, such as images from video cameras, signals from vibration detectors, crack gauges, inclinometers, etc. Thus, we can control, in real time, many parameters that affect the conservation of a monument. Data logger are very useful for pointing out when to carry out maintenance operations (Bayhan & Turhan, 2021).
We have already commented that many pathologies have their origin in the presence of humidity, which is accompanied by salts (Liu et al., 2020). The damaging effect of humidity on monuments is also well known (Kröner et al., 2010; Tortajada Hernando, 2011; Lovón & Lovón, 2019). Humidity mapping is usually carried out with the aim of knowing its origin from its distribution.
Sometimes, the presence of moisture is evident to us from stains or visible modifications of the surface. The humid zone traps dust and dirt from the environment and gives rise to fungal bio colonies that produce changes in tone or color (Caneva et al., 2000; Valgañón, 2008). Other times, areas that were wet have dried, but the stains remain. Other times, for different reasons, the presence of humidity is not evident from observation alone. It can also happen that humidity is transmitted mainly through the joints, while the stone is quite dry. In this case, they are difficult to appreciate visually.
Humidity mapping is carried out with a protimeter (Fig. 11). A protimeter is essentially a moisture measurement probe on surfaces. It makes point estimates of the electrical conductivity of the material. Distilled water hardly conducts electricity. However, in construction, moisture carries electrolytes due to dissolved salts. These electrolytes make this water quite conductive.
The determination of the humidity at each point is quite fast. Thus, we can take many points in a short time. These points can be established according to a regular grid, but it can be difficult in situ, due to access difficulties. (Fig. 14, left). When the element is linear, such as a column, profiles can be made (Fig. 13, color blue).
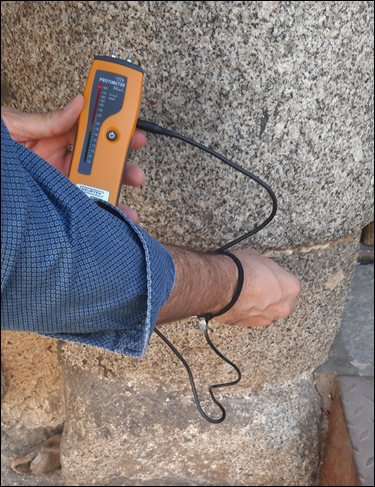
Figure 11: Humidity measurement using a protimeter in the columns of the access gate to the Palace of King Don Pedro, current School of Translators in Toledo, Spain (photograph by the author).
To carry out the mapping of salts, previously there was equipment on the market for the measurement of salts. However, some of this equipment has been discontinued, so it is less accessible. It forced many professionals to look for alternative solutions. Thus, Professor José María García de Miguel designed and built a piece of equipment based on electrical conductivity also (García de Miguel, 2009). In this equipment (Fig. 12) we do the measurement in a different way: we use filter paper, moistened with distilled water on the surface where we want to measure the saline content. Thus, the paper transmits moisture to the material. After a few seconds, the salts that lodge in the pores of the material dissolve in the moisture that impregnates the paper. So, we place the paper between some electrodes and measure the conductivity. This measured conductivity will be proportional to the saline content in the water dissolved in the paper and, ultimately, to the salts that have been extracted from the wall.
Naturally, in the case of very poorly soluble salts, such as calcium sulfate, a much higher content will be needed than in the case of sodium chloride, to provide the same conductivity value, and it can be objected that the measurement does not really estimate the content. Saline since it depends on its nature. This objection is real, but not very relevant to the intended practical effects. In fact, what is estimated is the capacity of the salt attack to produce damage, which is, ultimately, what is of interest. A low content of sodium chloride can be so harmful that a very high content of calcium sulfate will produce the same electrical conductivity (Alves et al., 2021). However, if we know the nature of the salts estimated by other methods that we will see in the next section and this salt composition is constant (for example, if there is only sodium chloride), we could prepare calibration curves with different concentrations of salts. And the response of the instrument at each concentration. Thus, we get an immediate relationship between the conductivity measurements obtained and the concentrations to which they correspond. However, this rarely interests us for practical purposes.
Restorers usually estimate the presence of salts from the dressings they use to extract them. However, this method is very cumbersome for diagnostic studies. It is because they require a dressing application time and another drying time. In addition, the salt content is modified after extraction. Restorers use it to verify the effectiveness of salt extraction already in the intervention phase; restorers also use it to check that the operation has been completed successfully. This occurs when they no longer detect salts in the dressings.
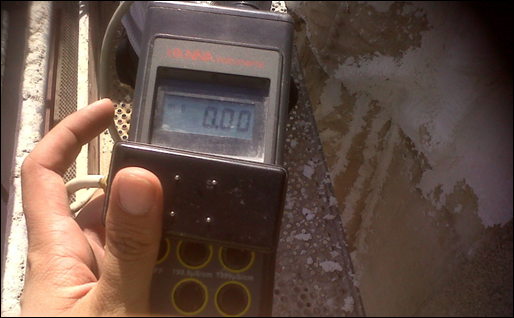
Figure 12: Equipment used for the measurement of conductivity and, therefore, for the measurement of salts in the Patio de Santo Tomás of the University of Alcalá de Henares, in Spain (photo by author).
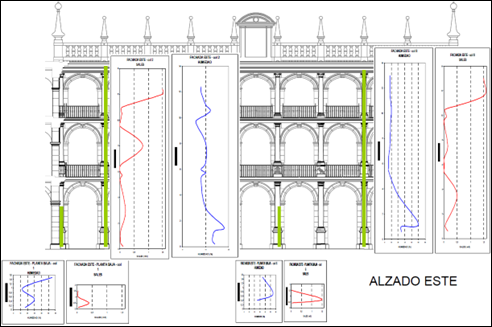
Figure 13: Moisture profiles (blue) and salt concentration profiles (red) in the plane of the east side facade in the Patio de Santo Tomás, at University of Alcalá de Henares, Spain (Elizalde, 2012).
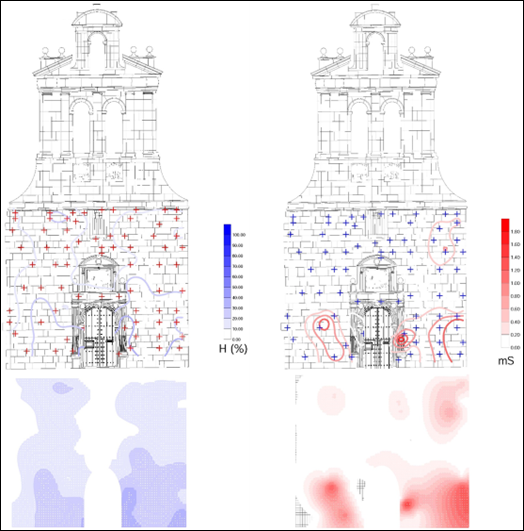
Figure 14: Humidity cartography (left) and salt concentration cartography (right) in the elevation of the main facade of the Chapel of San Ildefonso, in Alcalá de Henares, Spain (Elizalde, 2012).
One precaution that we have to take into account is that the measurements, both of humidity and salt, must always be carried out on the same material, be it stone (García de Miguel, 2009; San Andrés Moya & Viña Ferrer, 2009; Tortajada Hernando, 2011), either in the joint mortar (Papayianni, 2006; Guerra et al., 2019), or in brick (Lourenço, 2014). If we mix the data collections in different materials, the cartography can be distorted, because the values obtained depend on the porosity of these materials and the nature of these materials.
Normally, the most sensitive and most convenient material is the most porous material (Charola, 2000). However, highly absorbent materials can dry out the paper by immediately drawing out the moisture it contains. Once dry, this material will give us conductivity values much lower than the real ones, or it will not give us any value at all. In this case, we must choose the least porous material. For this reason, it is best to carry out two parallel cartographies: one in joints and another in the center of the pieces. Comparing both, we can see in most cases that the measurement carried out on the pieces reflects that of the joints, attenuated. The one that is estimated in the pieces better discriminates the main sources of humidity and salts, while one of the joints is, generally, more sensitive in detecting the distribution of humidity, where this is not revealed in the pieces.
The salt maps (Fig. 14, right) indicate the areas to be intervened by salt extraction, excluding the areas that do not present content. As mapping is much less expensive than extraction, you can save unnecessary costs by excluding many areas in the intervention.
The maps of salts and humidity can be superimposed. This superposition provides us with information about the presence of fossil salt fronts or active salt fronts. An occasional event such as, for example, the breakage of a sewage pipe, can be the cause of salts remaining after solving the cause that contributed the humidity, generating a fossil front.
The presence of moisture without salts are usually rare. These spots indicate areas of high circulation and little evaporation, so that the salts are transported, but not deposited and accumulated. In the fronts by capillarity, the low zones with a lot of permanent humidity usually present low saline values that increase in the evaporation zone at higher elevations.
We are not only interested in knowing the distribution of the salts provided by the cartography, but also their nature. This nature gives us a lot of useful information to determine the origin of the salts and to explain their presence.
For us it is very interesting to know how it is possible to have a first estimation of the nature of the salts from organoleptic data, mainly their taste. On the one hand, gypsum (calcium hydroxide) and caliches (calcium carbonate) are tasteless due to their low solubility. On the other hand, nitrates maintain a characteristic fresh and astringent taste. This flavour contrasts with the salty taste of chlorides: thus, potassium chloride and magnesium chloride are more pungent and more bitter than sodium chloride.
Sulfates other than gypsum are usually bitter (gypsum is tasteless, as we have already explained). This is the case of magnesium sulfate.
We can also make a kit of reagents that we can transport to the monument to be analyzed. This kit should contain (San Andrés Moya & de la Viña Ferrer, 2009):
- To recognize the presence of nitrates we can dissolve 0.5 g of diphenylamine in 100 ml of concentrated sulfuric acid. The acid, with the nitrates, provides a blue color. There are reactive paper strips for this same purpose.
- To recognize chlorides, we can introduce a small piece of the material in a small amount of water. When we add silver nitrate solution, precipitation of silver chloride occurs, which is insoluble.
- We can recognize the presence of gypsum by obtaining a precipitate of barium sulfate in an acid solution, adding barium chloride solution, as noted above. This procedure is also valid for locating other sulfates.
Beyond these simple techniques in situ, we must take a sample and analyze it later in the laboratory. The salts can be examined directly with a scanning electron microscope (García de Miguel, 2009). With this instrument we can appreciate its location in the pores of the material, we can know its morphology and we can estimate its composition, but it is difficult to make precise estimates of the number of salts.
For the quantitative determination, we have to carry out the extraction of the salts from the sample. To do this, we will weigh a small amount of the altered area and submerge it in a certain volume of distilled water (Kröner et al., 2010). We will leave this solution for half an hour at rest and filter it. We will reject the residue and evaporate the solution in a watch glass or a beaker. After this, we will weigh it. The ratio between the weight of this saline extract and that of the whole one estimated at the beginning will provide us with the total amount of soluble salts.
The nature of the saline substances present in the extract can be known using the scanning electron microscope. However, it is difficult for us to obtain a quantitative value with this technique. It is best to carry out a chemical analysis, determining the anions and cations after the extract has been dissolved. Of course, in this case, the chemical elements that make up the set of salts will be known, but not the substances that form these elements. This is because these elements can be combined in various ways to form different compounds. However, elemental analysis can be recalculated to molecular equivalents and combined to form the substances discovered by the scanning electron microscope. In this way, we can know the total proportion of salts present in the sample, as well as the substances and their proportion that make up the salt fraction.
The gypsum does not normally dissolve by this technique, or it does so in a small amount. But since gypsum by itself is not a very harmful salt, its determination is not important. It has already been described how the danger of calcium sulfate derives from its combination with other salts present to form others that are very soluble and dangerous. These salts will go into the solution without problems and will be considered in the analyses.
However, if we want the gypsum to pass into the salt extract, we will have to dissolve the salts in the sample while hot and for a certain time. We will also have to do the filtering while hot so that the plaster does not precipitate and remain with the residue.
Ultrasounds were developed to examine metals and welds and from there they went to medicine. Later they have begun to be used in construction.
This technique consists of an emitter of ultrasonic frequency longitudinal vibrations, which pass through the material, and are received by a receiver. The speed of propagation of the ultrasonic wave through the material is measured. This speed is directly related to the elastic modulus of the material and, therefore, to its mechanical properties (Diana & Fais, 2011; Jo & Lee, 2022). This speed is estimated by the space between the emitter and the receiver and the time it takes for the emitted signal to be acknowledged by the latter.
This technique requires good contact between the transducers (emitter and receiver) and the surface. For this, it is recommended to use petroleum jelly, grease, liquid soap or kaolin paste, and glycerol. The roughness of the surface is a drawback, so it may be necessary to polish it or use quick-setting epoxy resin.
There is a UNE standard (UNE-EN 14579:2005. Natural stone test methods – Determination of sound speed propagation), which specifies the method to carry out the test, both in the laboratory and in situ.
The estimation can be done by reflection, but it is usually done by transmission. The best situation occurs when you have two facing surfaces, such as a wall accessible from both sides. When estimation is not possible in this way, it is possible to place the emitter and receiver on the same surface (Fig. 15).
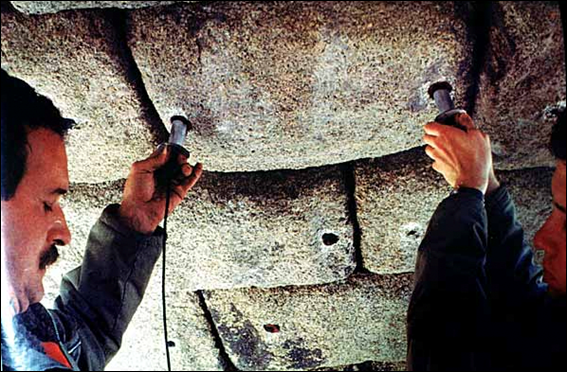
Figure 15: Auscultation of the ultrasonic transmission speed in the ashlars of the Roman Aqueduct of Segovia (Jurado, 2002)
Ultrasounds are used to measure the homogeneity of concrete and other identical materials (such as stone materials, which are the ones we are interested in). It has also been used to estimate the depth and direction of fractures within the material (Diana & Fais, 2011).
However, resistance estimation is strongly influenced by the distance between transducers, surface roughness, or humidity (Jo & Lee, 2022). Therefore, we should only apply this technique over dry materials.
Just as normal cameras detect the visible light emitted by objects and can capture it in a photograph, thermal imaging cameras do the same with infrared emissions. Infrared rays have a lower frequency than visible light. For this reason, the human eye cannot detect them. However, these rays can be perceived organoleptically as heat. Thus, the camera records the temperature of the different objects in an image (Fig. 18). Depending on the camera, it can become sensitive to hundredths of a degree.
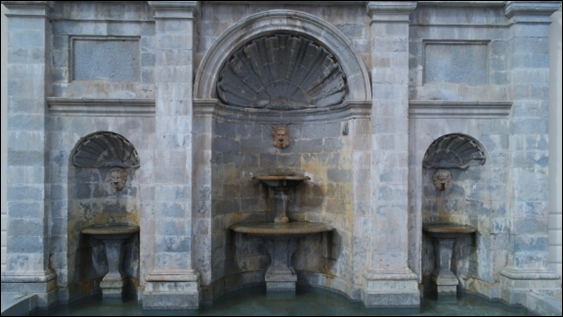
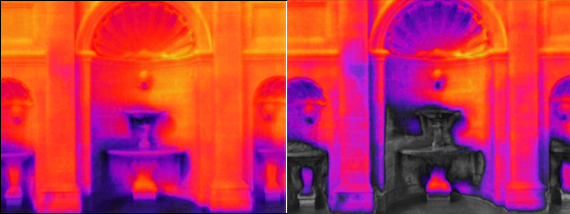
Figure 16: Thermographic analysis of the Ventura Rodríguez Fountain, an ornamental fountain from the 18th century, in Boadilla del Monte, in Spain (photo by author).
Next, we can see the thermographic analysis of the interior of a vault of a masonry arch bridge (Fig. 17) and of the gable end of the bridge abutment with the range of temperatures (Fig. 18). Both images correspond to the Grajal Bridge, inspected by the author (Elizalde, 2022).
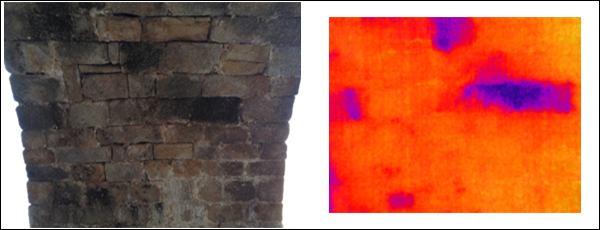
Figure 17: Comparison between the real image (left) and the image captured by the thermographic camera (right), inside the vault of the Puente del Grajal (photographs by the author).
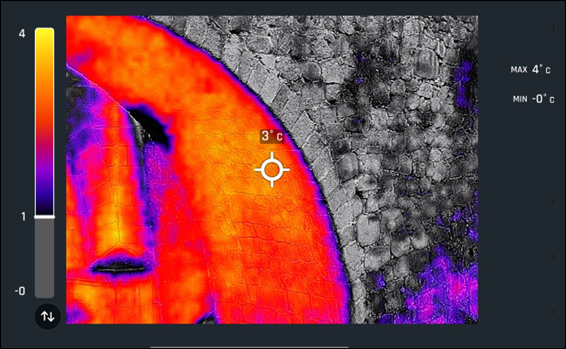
Figure 18: Thermographic analysis of the Grajal Bridge, in Spain, with relative scale of temperatures recorded during the inspection (photo by author).
Thermography is another technique that we can also use to detect possible defects in masonry. Infrared thermography allows, through the infrared radiation emitted by bodies, the surface temperature measurement (Pappalardo et al., 2022). The instrument used in thermography to measure is the infrared camera. The main advantage of thermographic temperature measurement is that it is a non-contact measurement technique (Diana & Fais, 2011). In recent years, new thermal imaging cameras have greatly decreased in price and can help us to appreciate cracks and anomalies. The campaigns must be carried out at dusk or dawn because what the cameras detect is the different temperature that manifests itself in the walls of the monument and it is at these times when it is easier to observe the possible presence of non-homogeneous areas that will dissipate the heat of differently (Carlomagno et al., 2005).
Thermography is used to locate damp zones in walls (Moropoulou et al. 2018). Thermography can be related to the microclimatic effect that we analyzed in the previous section. (Hatır et al., 2022). As we have said, it is because humid areas must be colder. This is due to heat loss through evaporation. However, the thermal history often masks useful signals.
Thermography has also been used to detect blistering in paint and plaster, as well as other surface or structural features capable of producing thermal contrasts. In fact, there are joint experiences of using thermography with photogrammetry, using drones (Frodella et al., 2020).
Throughout this article, the immediate and instrumental techniques most used by the author and many other experts in the pathological diagnosis of heritage constructions have been analyzed. All the techniques analyzed have demonstrated their effectiveness in making an adequate diagnosis. Many monuments have been saved in time using these techniques harmless with the monument.
However, there are many other techniques that we have not analyzed here, such as endoscopy, georadar, and other geophysical techniques or tomography that are either under study or have already begun to prove effective in the field of diagnosis. These techniques, together with laboratory techniques (electron microscopy, X-ray diffraction and fluorescence, spectrometry…), can give a much more complete diagnosis, although not as fast as the one provided by the techniques in the sections above have been analyzed. In addition, laboratory techniques always involve the extraction of samples, and this always implies a punishment, however small, for the monument.
- García de Miguel, J. M. (2009). Tratamiento y conservación de la piedra, el ladrillo y los morteros: en monumentos y construcciones. Consejo general de la Arquitectura técnica de España. Retrieved from https://www.worldcat.org/title/tratamiento-y-conservacion-de-la-piedra-el-ladrillo-y-los-morteros-en-monumentos-y-construcciones/oclc/733807943
- Rojo, Á. N. (2020). Las inspecciones de puentes de carreteras. Carreteras: Revista técnica de la Asociación Española de la Carretera, 229, 6-13. Retrieved from https://dialnet.unirioja.es/servlet/articulo?codigo=7623550
- Hugenschmidt, J. & Mastrangelo, R. (2006). GPR inspection of concrete bridges. Cement and Concrete Composites, 28(4), 384-392. DOI: http://dx.doi.org/10.1016%2Fj.cemconcomp.2006.02.016
- Sandberg, J., Pires, C., McKay, N., Laco, J. & Mitchell, R. (2022). Inspection and assessment. In ICE Manual of Bridge Engineering, Third edition (pp. 719-756). ICE Publishing. Retrieved from https://www.icevirtuallibrary.com/doi/abs/10.1680/icembe.63051.0719
- Tortajada Hernando, S. (2011). La conservación preventiva durante la exposición de esculturas en piedra. Ediciones Trea. Retrieved from https://herder.com.mx/es/libros-books/la-conservacion-preventiva-durante-la-exposicion-de-esculturas-en-piedra/sonia
- Bianchi, E. & Hebdon, M. (2022). Visual structural inspection datasets. Automation in Construction, 139(2), 104299. Retrieved from https://www.sciencedirect.com/science/article/abs/pii/S0926580522001728?via%3Dihub
- Elizalde, R. R. (2022). Structural Inspection by RPAS (Drones): Quality Work with Preventive Guarantee. Journal of Engineering and Applied Sciences Technology, 4(2), 1-11. DOI: doi.org/10.47363/JEAST/2022(4)143
- Elizalde, R. R. (2022). Use of RPAS (drones) for masonry arch bridges inspection: application on Grajal Bridge. International Journal of Current Research, 14(7), 21954-21960. Retrieved from http://journalcra.com/article/use-rpas-drones-masonry-arch-bridges-inspection-application-grajal-bridge
- Kröner, S., i Barberà, X. M., Cortina, L. O. & Ferré, N. G. (2010). Identificación y caracterización de materiales pétreos en patrimonio histórico-artístico. Editorial Universitat Politècnica de València. Retrieved from https://gdocu.upv.es/alfresco/service/api/node/content/workspace/SpacesStore/e7592ecd-de50-41d6-a695-3ba949d033b2/TOC_0635_06_01.pdf?guest=true
- García de Miguel, J. M. (2009). Tratamiento y conservación de la piedra, el ladrillo y los morteros: en monumentos y construcciones. Consejo general de la Arquitectura técnica de España. Retrieved from https://www.worldcat.org/title/tratamiento-y-conservacion-de-la-piedra-el-ladrillo-y-los-morteros-en-monumentos-y-construcciones/oclc/733807943
- García Moreno, O. & Corretgé Castañón, L. G. (2000). Enclaves en granitos peralumínicos alóctonos: El caso del Batolito de Cabeza de Araya (Cáceres, España). Geogaceta, 27, 67-70. Retrieved from https://sge.usal.es/archivos/geogacetas/Geo27/Art17.pdf
- Wiebe, R. A., Jellinek, M., Markley, M. J., Hawkins, D. P. & Snyder, D. (2007). Steep schlieren and associated enclaves in the Vinalhaven granite, Maine: possible indicators for granite rheology. Contributions to Mineralogy and Petrology, 153(2), 121-138. DOI: http://dx.doi.org/10.1007/s00410-006-0142-z
- Alemany, R. M. E. (2007). Alteración de rocas graníticas utilizadas en edificación. Materiales de construcción, 57(288), 77-89. Retrieved from https://digibuo.uniovi.es/dspace/handle/10651/8484
- Liu, Z., Yuan, D. & Dreybrodt, W. (2005). Comparative study of dissolution rate-determining mechanisms of limestone and dolomite. Environmental Earth Sciences, 49(2), 274-279. DOI: http://dx.doi.org/10.1007/s00254-005-0086-z
- Bell, R. G. (1992). The durability of sandstone as building stone, especially in urban environments. Bulletin of the Association of Engineering Geologists, 29(1), 49-60. Retrieved from https://pubs.geoscienceworld.org/aeg/eeg/article-abstract/xxix/1/49/137303/The-Durability-of-Sandstone-as-Building-Stone?redirectedFrom=fulltext
- Papayianni, I. (2006). The longevity of old mortars. Applied Physics A, 83(4), 685-688. Retrieved from https://link.springer.com/article/10.1007/s00339-006-3523-2
- Elsen, J., Balen, K. V. & Mertens, G. (2012). Hydraulicity in historic lime mortars: a review. Historic mortars, 7, 125-139. DOI: http://dx.doi.org/10.1007/978-94-007-4635-0_10
- Figueiredo, M. O., Silva, T. P. & Veiga, J. P. (2008). Analysis of degradation phenomena in ancient, traditional and improved building materials of historical monuments. Applied Physics A, 92(1), 151-154. Retrieved from https://link.springer.com/article/10.1007/s00339-008-4466-6
- Lourenço, P. B., Hees, R. V., Fernandes, F. & Lubelli, B. (2013). Characterization and damage of brick masonry. In Structural rehabilitation of old buildings, 2, pp. 109-130. Springer, Berlin, Heidelberg. Retrieved from https://link.springer.com/chapter/10.1007/978-3-642-39686-1_4
- Camuffo, D. (1986). Deterioration processes of historical monuments. In Studies in Environmental Science, 30(189-221). Elsevier. DOI: https://doi.org/10.1016/S0166-1116(08)70884-7
- Franzini, M. (1995). Stones in monuments: natural and anthropogenic deterioration of marble artifacts. European Journal of Mineralogy, 7(4), 735–743. Retrieved from https://pubs.geoscienceworld.org/eurjmin/article-abstract/7/4/735/62738/Stones-in-monuments-natural-and-anthropogenic
- García de Miguel, J. M. (2017). Mecanismos de deterioro de los puentes de piedra o ladrillo. In Los puentes de piedra (o ladrillo) antaño y hogaño. Fundación Juanelo Turriano. pp. 169-182. Retrieved from https://biblioteca.juaneloturriano.com/Record/Xebook1-11108/t/mecanismos-de-deterioro-de-los-puentes-de-piedra-o-ladrillo-jose-maria-garcia-de-miguel
- Katona, V. (2020). Relief method: The analysis of architectonic façades by fractal geometry. Buildings, 11(1), 16. Retrieved from https://www.semanticscholar.org/paper/Relief-Method%3A-The-Analysis-of-Architectonic-by-Katona/22395d4eaf7981c56f844ea633bd02019903a369
- ICOMOS-ISCS (2008). Illustrated glossary on stone deterioration patterns / Glossaire illustré sur les formes d’altération de la Pierre. Available online: http://openarchive.icomos.org/id/eprint/434/1/Monuments_and_Sites_15_ISCS_Glossary_Stone.pdf (last acces on 8th october 2022)
- Elizalde, R. R. (2012). Análisis de los factores climáticos y ambientales y su afección a los materiales pétreos empleados en el patio de Santo Tomás de la Universidad de Alcalá de Henares, Universidad Politécnica de Madrid (Graduation final project)
- San Andrés Moya, M. & de la Viña Ferrer, S. (2004). Fundamentos de química y física para la conservación y restauración. Síntesis. Retrieved from https://www.sintesis.com/patrimonio%20cultural-23/fundamentos%20de%20qu%C3%ADmica%20y%20f%C3%ADsica%20para%20la%20conservaci%C3%B3n%20y%20restauraci%C3%B3n-libro-566.html
- Kröner, S., i Barberà, X. M., Cortina, L. O. & Ferré, N. G. (2010). Identificación y caracterización de materiales pétreos en patrimonio histórico-artístico. Editorial Universitat Politècnica de València. Retrieved from https://gdocu.upv.es/alfresco/service/api/node/content/workspace/SpacesStore/e7592ecd-de50-41d6-a695-3ba949d033b2/TOC_0635_06_01.pdf?guest=true
- Lourenço, P. B., Hees, R. V., Fernandes, F. & Lubelli, B. (2013). Characterization and damage of brick masonry. In Structural rehabilitation of old buildings, 2, pp. 109-130. Springer, Berlin, Heidelberg. Retrieved from https://link.springer.com/chapter/10.1007/978-3-642-39686-1_4
- Zhao, C., Zhang, Y., Wang, C. C., Hou, M. & Li, A. (2019). Recent progress in instrumental techniques for architectural heritage materials. Heritage Science, 7(1), 1-50. Retrieved from https://heritagesciencejournal.springeropen.com/articles/10.1186/s40494-019-0280-z
- Aydin, A. & Basu, A. (2005). The Schmidt hammer in rock material characterization. Engineering Geology, 81(1), 1-14. DOI: https://doi.org/10.1016/j.enggeo.2005.06.006
- Aydin, A. (2008). ISRM suggested method for determination of the Schmidt hammer rebound hardness: revised version. International Journal of Rock Mechanics & Mining Sciences, 2007-2014, 25-33. DOI: 10.1016/j.ijrmms.2008.01.020
- Kong, F., Xue, Y., Qiu, D., Gong, H. & Ning, Z. (2021). Effect of grain size or anisotropy on the correlation between uniaxial compressive strength and Schmidt hammer test for building stones. Construction and Building Materials, 299, 123941. DOI: https://doi.org/10.1016/j.conbuildmat.2021.123941
- Williams, R. B. G. & Robinson, D. A. (1983). The effect of surface texture on the determination of the surface hardness of rock using the Schmidt hammer. Earth Surface Processes and Landforms, 8(3), 289-292. DOI: https://doi.org/10.1002/esp.3290080311
- Vandaele, K. & Waelken, M. (1993). Evaluation of Surface Hardness of Building Stones As A Tool for Relative Dating. Sagalassos III Report on the Fourth Excavations Campaign of, 137-141.
- Buyuksagis, I. S. & Goktan, R. M. (2007). The effect of Schmidt hammer type on uniaxial compressive strength prediction of rock. International Journal of Rock Mechanics and Mining Sciences, 44(2), 299-307. DOI: https://doi.org/10.1016/j.ijrmms.2006.07.008
- Bionda, D. (2004). Salt deterioration and microclimate in historical buildings. Intermediary Report of the Project. Institut für Denkmalpflege, Forschungsstelle Technologie und Konservierung, ETH Zürich, 1-10. Retrieved from https://www.research-collection.ethz.ch/handle/20.500.11850/148075
- Camuffo, D. (2019). Microclimate for cultural heritage: Measurement, risk assessment, conservation, restoration, and maintenance of indoor and outdoor monuments. Elsevier. Retrieved from https://www.elsevier.com/books/microclimate-for-cultural-heritage/camuffo/978-0-444-64106-9
- Guerra, F. L., Lopes, W., Cazarolli, J. C., Lobato, M., Masuero, A. B., Dal Molin, D. C., Bento, F. M., Schrank, A. & Vainstein, M. H. (2019). Biodeterioration of mortar coating in historical buildings: Microclimatic characterization, material, and fungal community. Building and Environment, 155, 195-209. Retrieved from https://typeset.io/papers/biodeterioration-of-mortar-coating-in-historical-buildings-5e6w736ikj
- Austigard, M. S. & Mattsson, J. (2019). Monitoring climate change related biodeterioration of protected historic buildings. International Journal of Building Pathology and Adaptation, 38(04), 529–38. DOI: https://doi.org/10.1108/IJBPA-11-2018-0094
- Essien, V., Bolu, C. A., Azeta, J., Okokpujie, I. P., Kilanko, O. & Afolalu, S. A. (2021, April). Application of Data Logger for Monitoring Indoor and Outdoor Temperature of Buildings: A Review. In IOP Conference Series: Materials Science and Engineering, 1107(1), p. 012181. IOP Publishing. Retrieved from https://www.proquest.com/docview/2518771910
- Bayhan, A. Y. & Turhan, C. (2021). Development of a solar-based temperature and relative humidity data logger. Turkish Journal of Electromechanics and Energy, 6(1), 12-17.
- Liu, X., Koestler, R. J., Warscheid, T., Katayama, Y. & Gu, J. D. (2020). Microbial deterioration and sustainable conservation of stone monuments and buildings. Nature Sustainability, 3(12), 991-1004. Retrieved from https://research.gtiit.edu.cn/en/publications/microbial-deterioration-and-sustainable-conservation-of-stone-mon
- Lovón, R. & Lovón, E. (2019). The Impact of Humidity on the Resistance of Historic Adobe Monuments. In Structural Analysis of Historical Constructions, 18, 1959-1967. Springer, Cham. Retrieved from https://link.springer.com/chapter/10.1007/978-3-319-99441-3_210
- Caneva, G., Nugari, M. P. & Salvadori, O. (2000). La biología en la restauración (Vol. 5). Editorial Nerea. Retrieved from https://www.abebooks.com/book-search/author/caneva-g-nugari-m-p-salvadori-o/
- Valgañón, V. (2008). Biología aplicada a la conservación y restauración. Síntesis. Retrieved from https://www.sintesis.com/patrimonio%20cultural-23/biolog%C3%ADa%20aplicada%20a%20la%20conservaci%C3%B3n%20y%20restauraci%C3%B3n-libro-106.html
- Alves, C., Figueiredo, C. A. M., Sanjurjo-Sánchez, J. & Hernández, A. C. (2021). Salt weathering of natural stone: a review of comparative laboratory studies. Heritage, 4(3), 1554-1565. DOI: https://doi.org/10.3390/heritage4030086
- Charola, A. E. (2000). Salts in the deterioration of porous materials: an overview. Journal of the American institute for conservation, 39(3), 327-343. DOI: https://doi.org/10.1179/019713600806113176
- Diana, G., & Fais, S. (2011). IR thermography and ultrasonic investigations in the Cultural Heritage field. 15th International Conference on “Cultural Heritage and New Technologies“ Vienna, 2010; Stadt Archaologie, WienAt: http://www.stadtarchaeologie.at/wp-content/uploads/eBook_WS15_Part5_Postersession+Award.pdf In Workshop 15, 15-17. Retrieved from https://www.researchgate.net/publication/276159275_Ir_thermography_and_ultrasonic_investigations_in_the_cultural_heritage_field
- Jo, Y. H. & Lee, C. H. (2022). Ultrasonic Properties of a Stone Architectural Heritage and Weathering Evaluations Based on Provenance Site. Applied Sciences, 12(3), 1498. DOI: http://dx.doi.org/10.3390/app12031498
- Jurado, F. (2002). El Acueducto romano de Segovia. Obra Pública Ingeniería y Territorio, 57, Monográfico Ingeniería e Historia III, 14-23. Retrieved from http://www.traianvs.net/textos/segovia.htm
- Pappalardo, G., Mineo, S., Caliò, D. & Bognandi, A. (2022). Evaluation of Natural Stone Weathering in Heritage Building by Infrared Thermography. Heritage, 5(3), 2594-2614. DOI: https://doi.org/10.3390/heritage5030135
- Carlomagno, G. M., Di Maio, R., Meola, C. & Roberti, N. (2005). Infrared thermography and geophysical techniques in cultural heritage conservation. Quantitative InfraRed Thermography Journal, 2(1), 5-24. DOI: https://doi.org/10.3166/qirt.2.5-24
- Moropoulou, A., Avdelidis, N. P., Karoglou, M., Delegou, E. T., Alexakis, E. & Keramidas, V. (2018). Multispectral applications of infrared thermography in the diagnosis and protection of built cultural heritage. Applied Sciences, 8(2), 284. DOI: http://dx.doi.org/10.3390/app8020284
- Hatır, M. E., İnce, İ. & Bozkurt, F. (2022). Investigation of the effect of microclimatic environment in historical buildings via infrared thermography. Journal of Building Engineering, 57, 104916. DOI: https://www.sciencedirect.com/science/article/abs/pii/S2352710222009287
- Frodella, W., Elashvili, M., Spizzichino, D., Gigli, G., Adikashvili, L., Vacheishvili, N., Kirkitadze, G., Nadaraia, A., Margottini, C. & Casagli, N. (2020). Combining Infrared thermography and UAV digital photogrammetry for the protection and conservation of rupestrian cultural heritage sites in Georgia: A methodological application. Remote Sensing, 12(5), 892. DOI: https://www.mdpi.com/2072-4292/12/5/892#